换一个起点,换一个冠军:美股六十年回报全景Move the Starting Line, Change the Champion: Sixty Years of US Stock Returns
A web original — first published here on September 21, 2026.本文 2026.09.21 首发于本站。
目录Contents
- 01 On the day each champion listed, the previous generation could not make sense of it
- 02 Apple is the only company across five generations, because it died once
- 03 Shovel sellers outlive gold diggers
- 04 Dividends are vanishing from the list of champions
- 05 The winners are getting fewer, and faster
- 06 China's mirror: champions, but no machine that produces champions
- The other side
- Three sentences
- My own two cents
本文 2026 年 9 月 21 日首发于 klay-wang.com
导读| 上周我写完家得宝 45 年 1.6 万倍那篇,自己冒出一个问题:为什么是 45 年?把起点往前挪五年,家得宝还没上市;往后挪五年,它从第一掉到第九。于是我把美股 205 只有名的长跑股全拉了一遍,从 10 年到 60 年每五年一个起点,十一场比赛:烟草、折扣店、五金仓库、软件、能量饮料、芯片,冠军换了七家公司、六个行业。每一代冠军上市的那一天,上一代都看不懂它。这篇讲那张表,以及表背后的四件事:起跑线比公司重要,卖铲子的比淘金的活得久,股息正在从冠军名单里消失,赢家越来越少也越来越快。最后一节讲中国:我们有单个冠军,缺的是生产冠军的那台机器。
全文约 7500 字,阅读时长建议不小于 18 分钟。
美股没有永远的冠军,只有每一个起点的冠军。起点每挪五年,第一名换一家公司,换的不只是公司,是行业。
下面这张表是我自己算的。205 只候选股,全是活到今天、有名有姓的长跑股,终点统一 2026 年 9 月 18 日,含股息再投资,数据来自 Yahoo Finance 的复权序列。60 年那档候选池里一只都没有,因为 1966 年之前上市又活到今天且我认得的公司,只剩伯克希尔和几家老烟草老石油,伯克希尔的数我用巴菲特信里的官方口径补上。
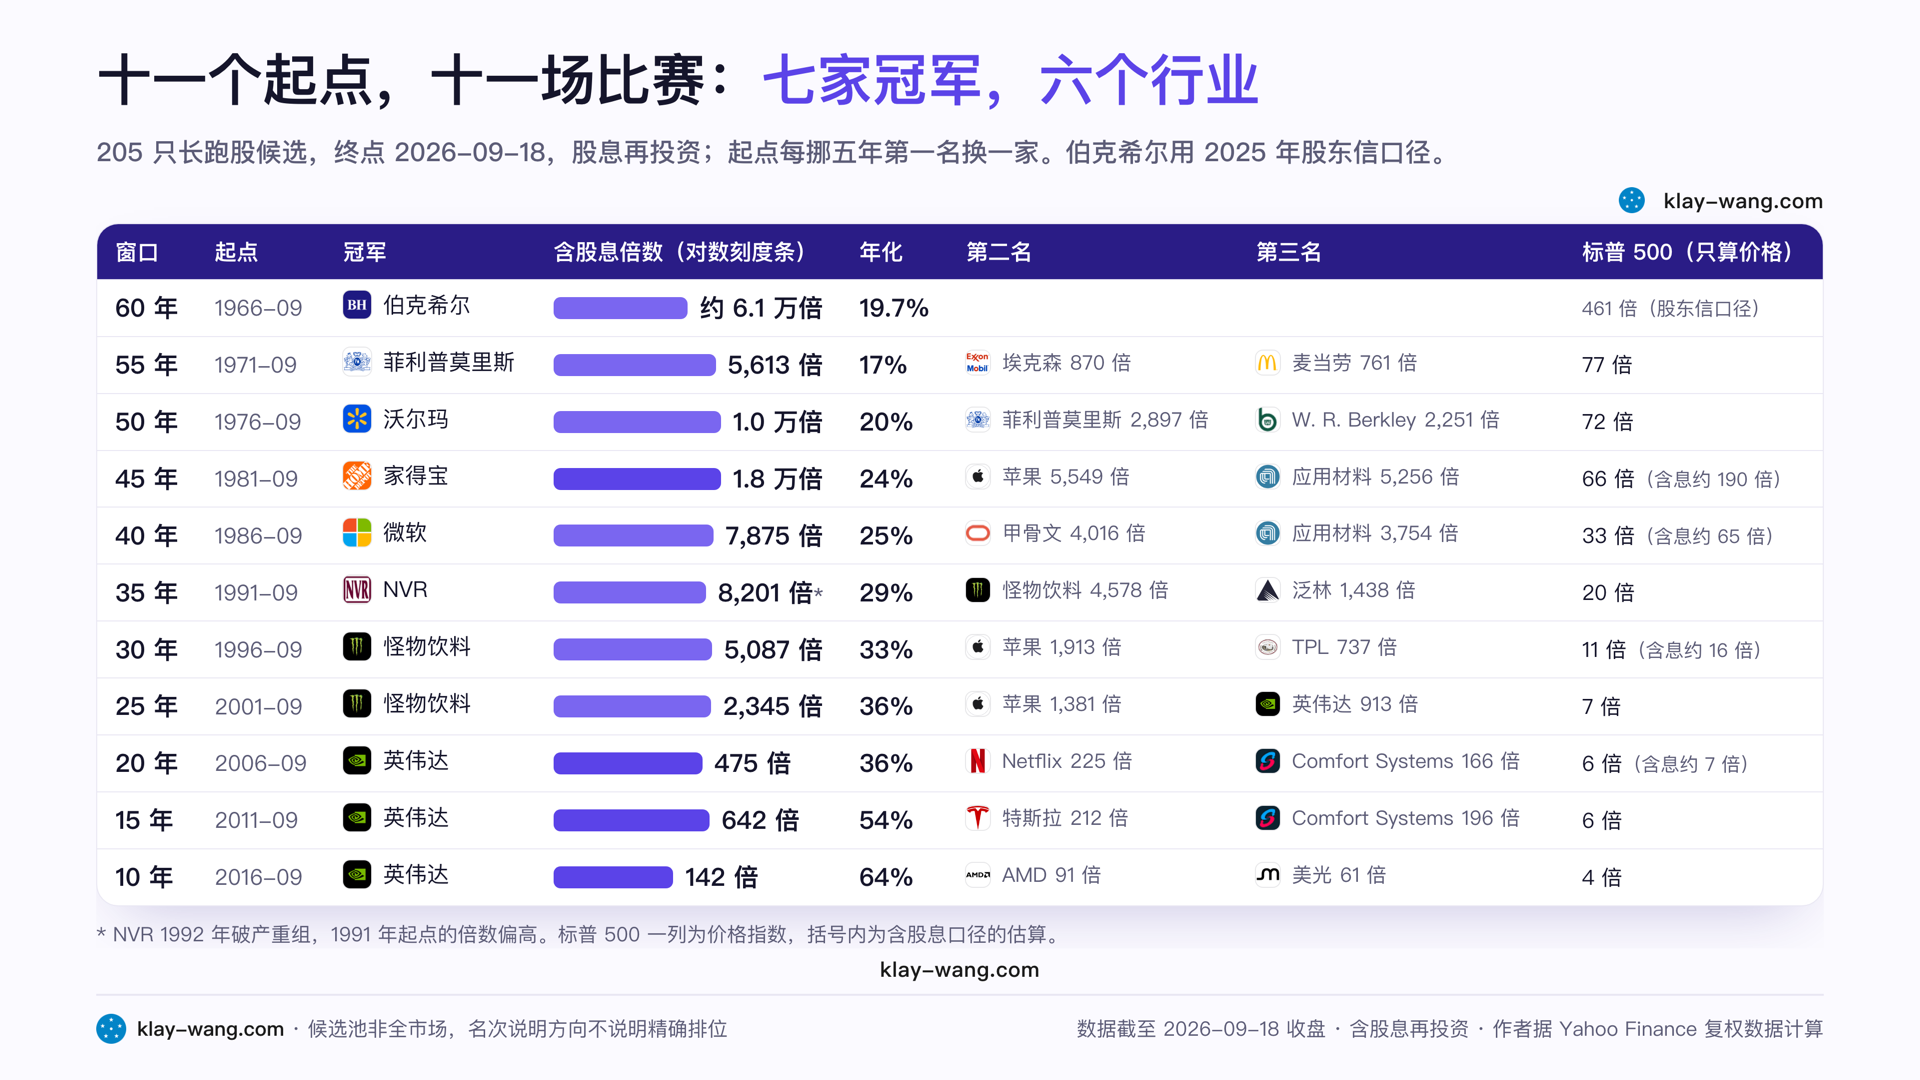
十一个起点,七家不同的冠军。英伟达赢了最近三场,家得宝只赢了 45 年这一场,怪物饮料赢了两场。往前数,每一场的冠军都是上一场没人看好的公司。
表里标普那一列是价格指数,没算股息。把股息再买回去,1981 年起大约 190 倍,1986 年起约 65 倍,1996 年起约 16 倍,2006 年起约 7 倍,比表里的数大两三倍。冠军和指数的差距要拿这个数去比。
01 每一代冠军上市那天,上一代都看不懂它
我给这些起点按行业分了代,每一代钉一个上市日。
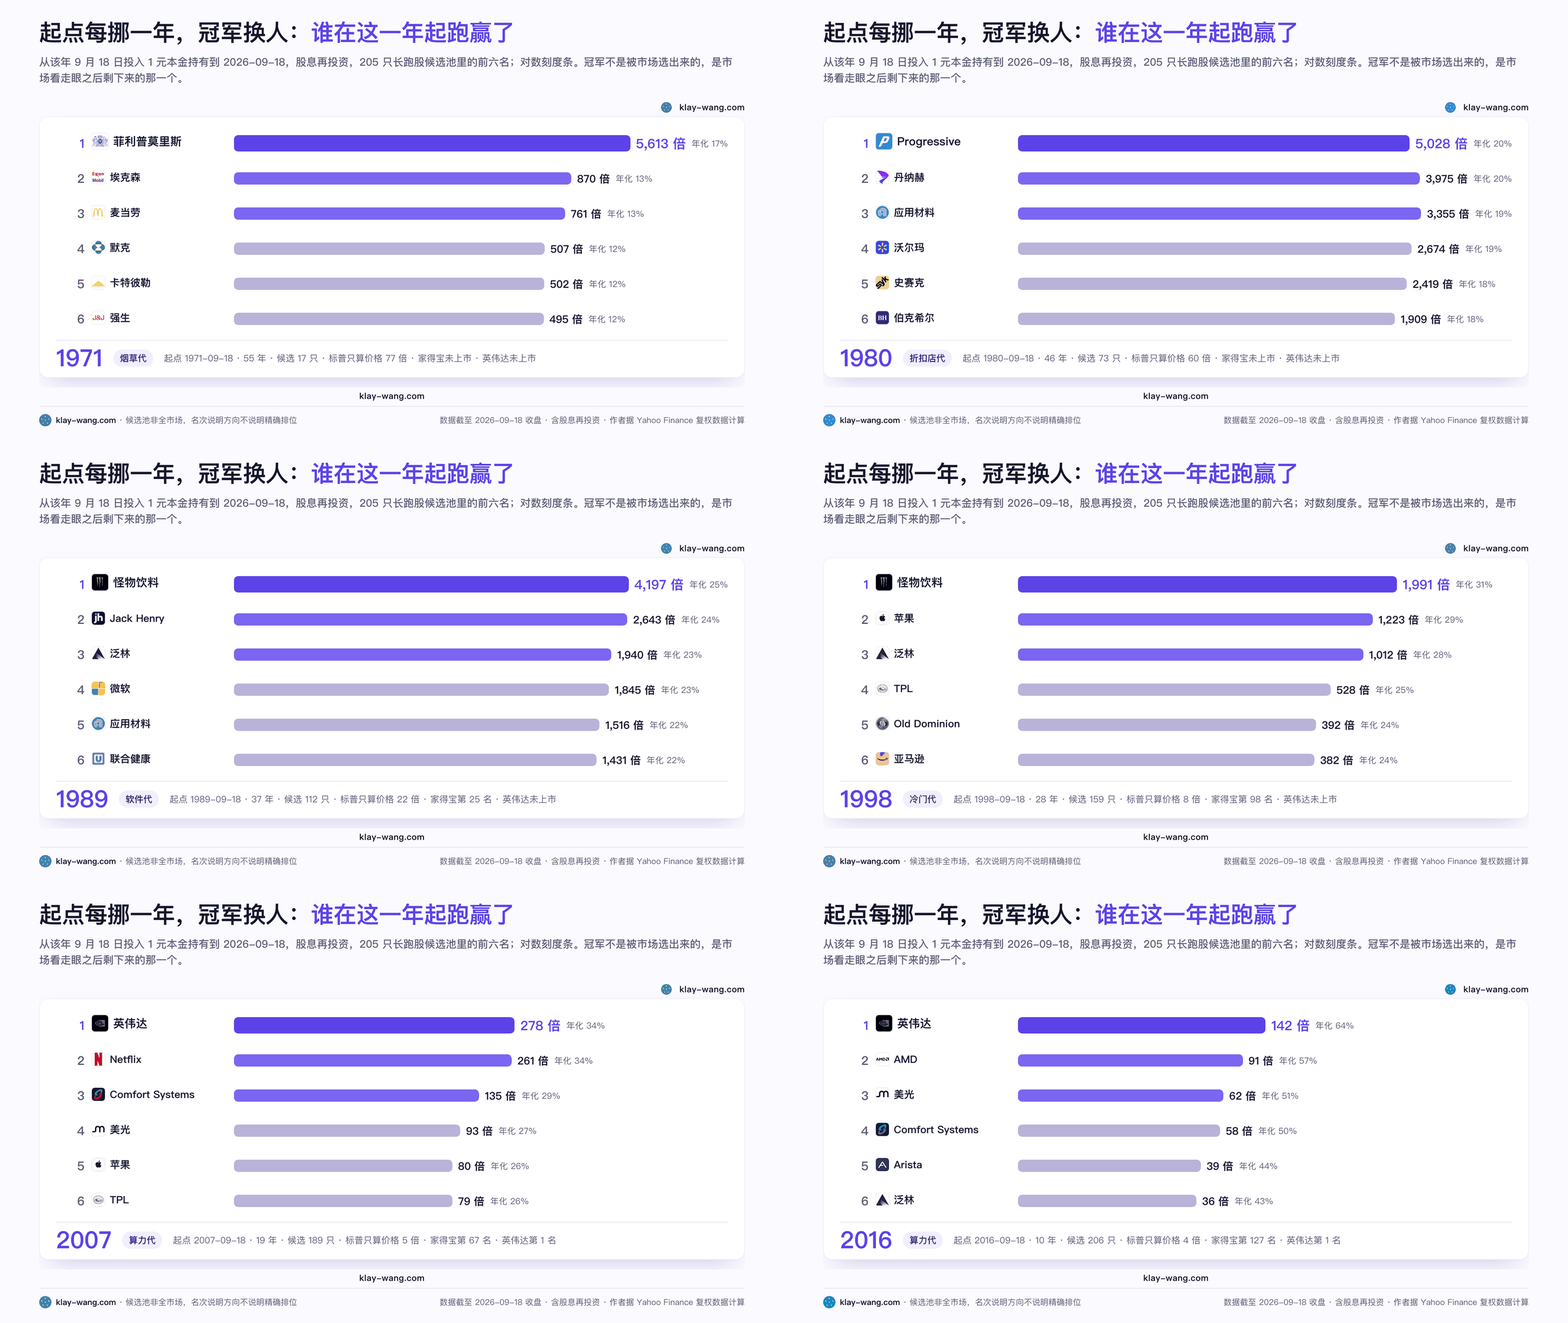
烟草代,1971 年起点。 菲利普莫里斯 55 年 5613 倍,年化 17%。它没有增长故事,1971 年的美国人已经在抽烟了。它的秘密留到第 04 节,先记一个数:只看股价,55 年只有 98 倍。
折扣店代,1976 年起点。 沃尔玛 50 年 10260 倍。它 1970 年 10 月 1 日上市,30 万股,16.5 美元一股,总共募了 495 万美元,一家阿肯色州的公司,专挑大连锁看不上的小镇开店。
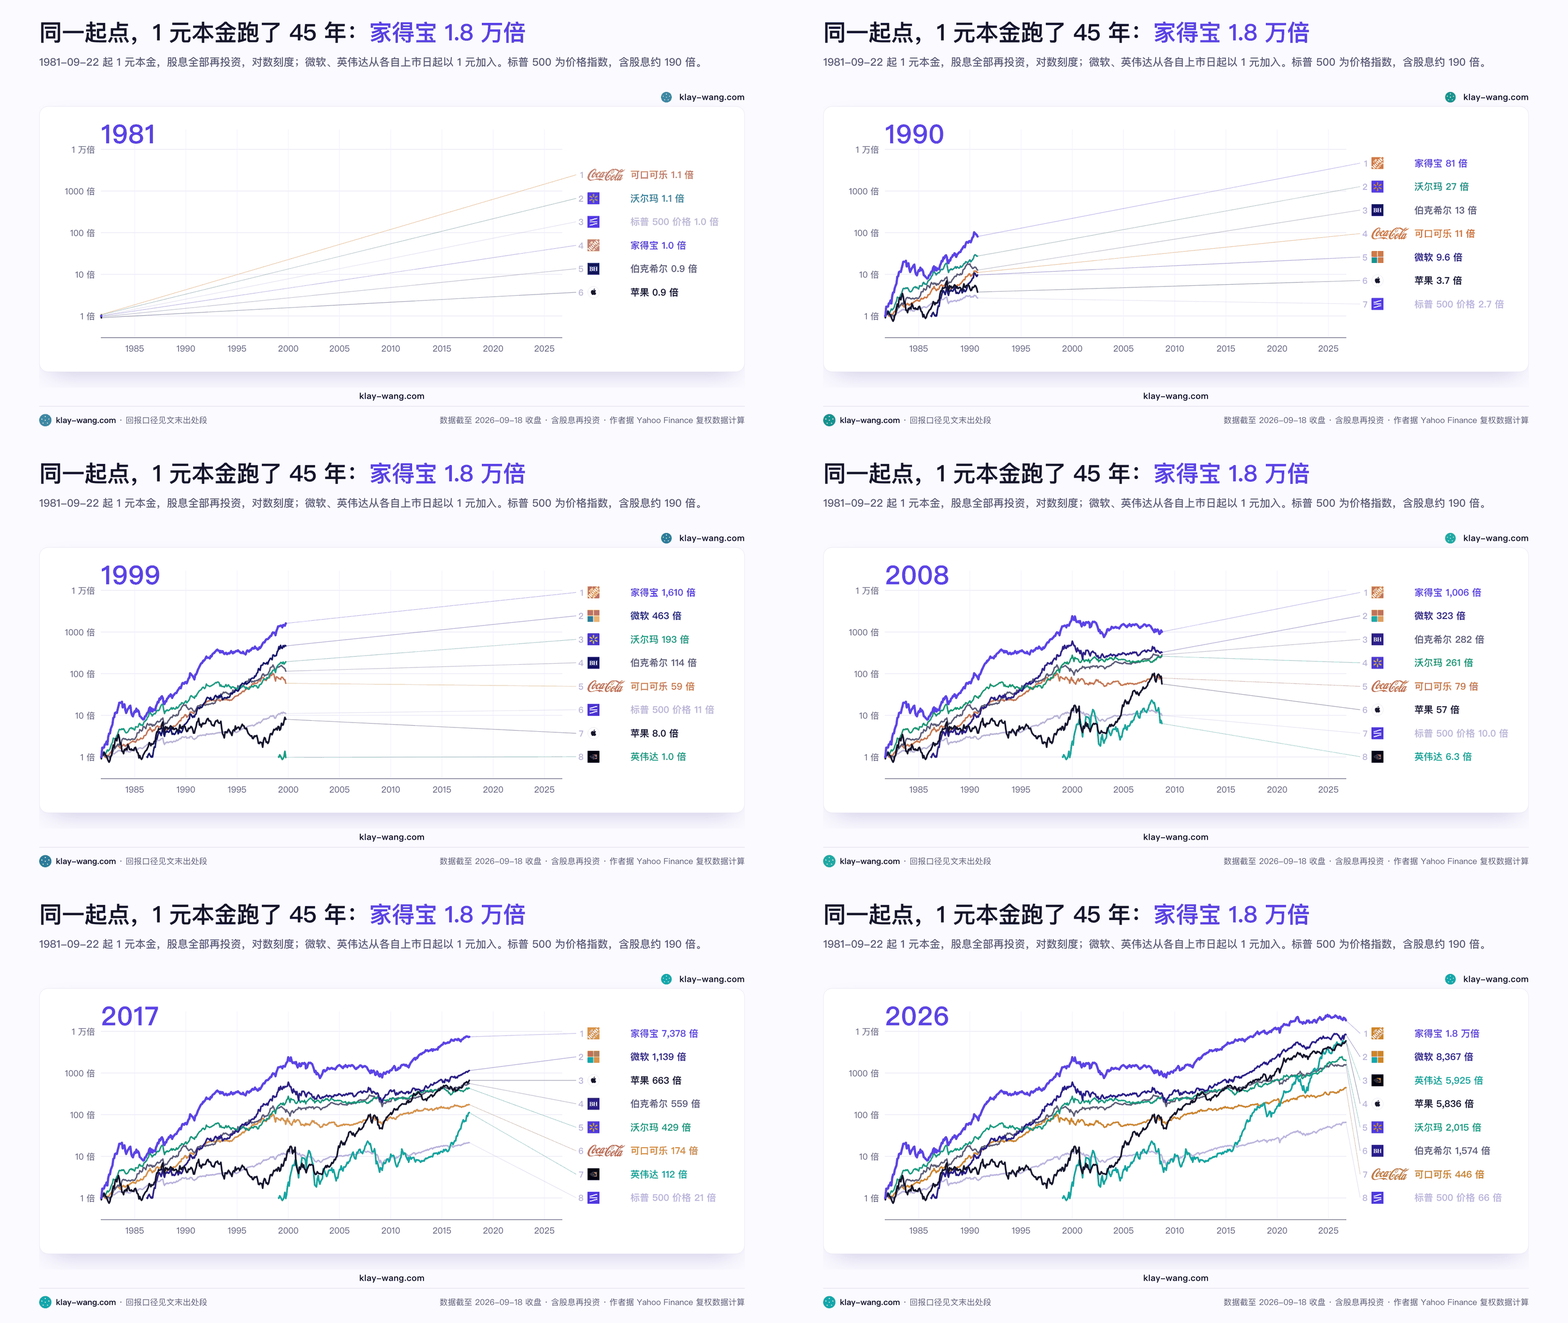
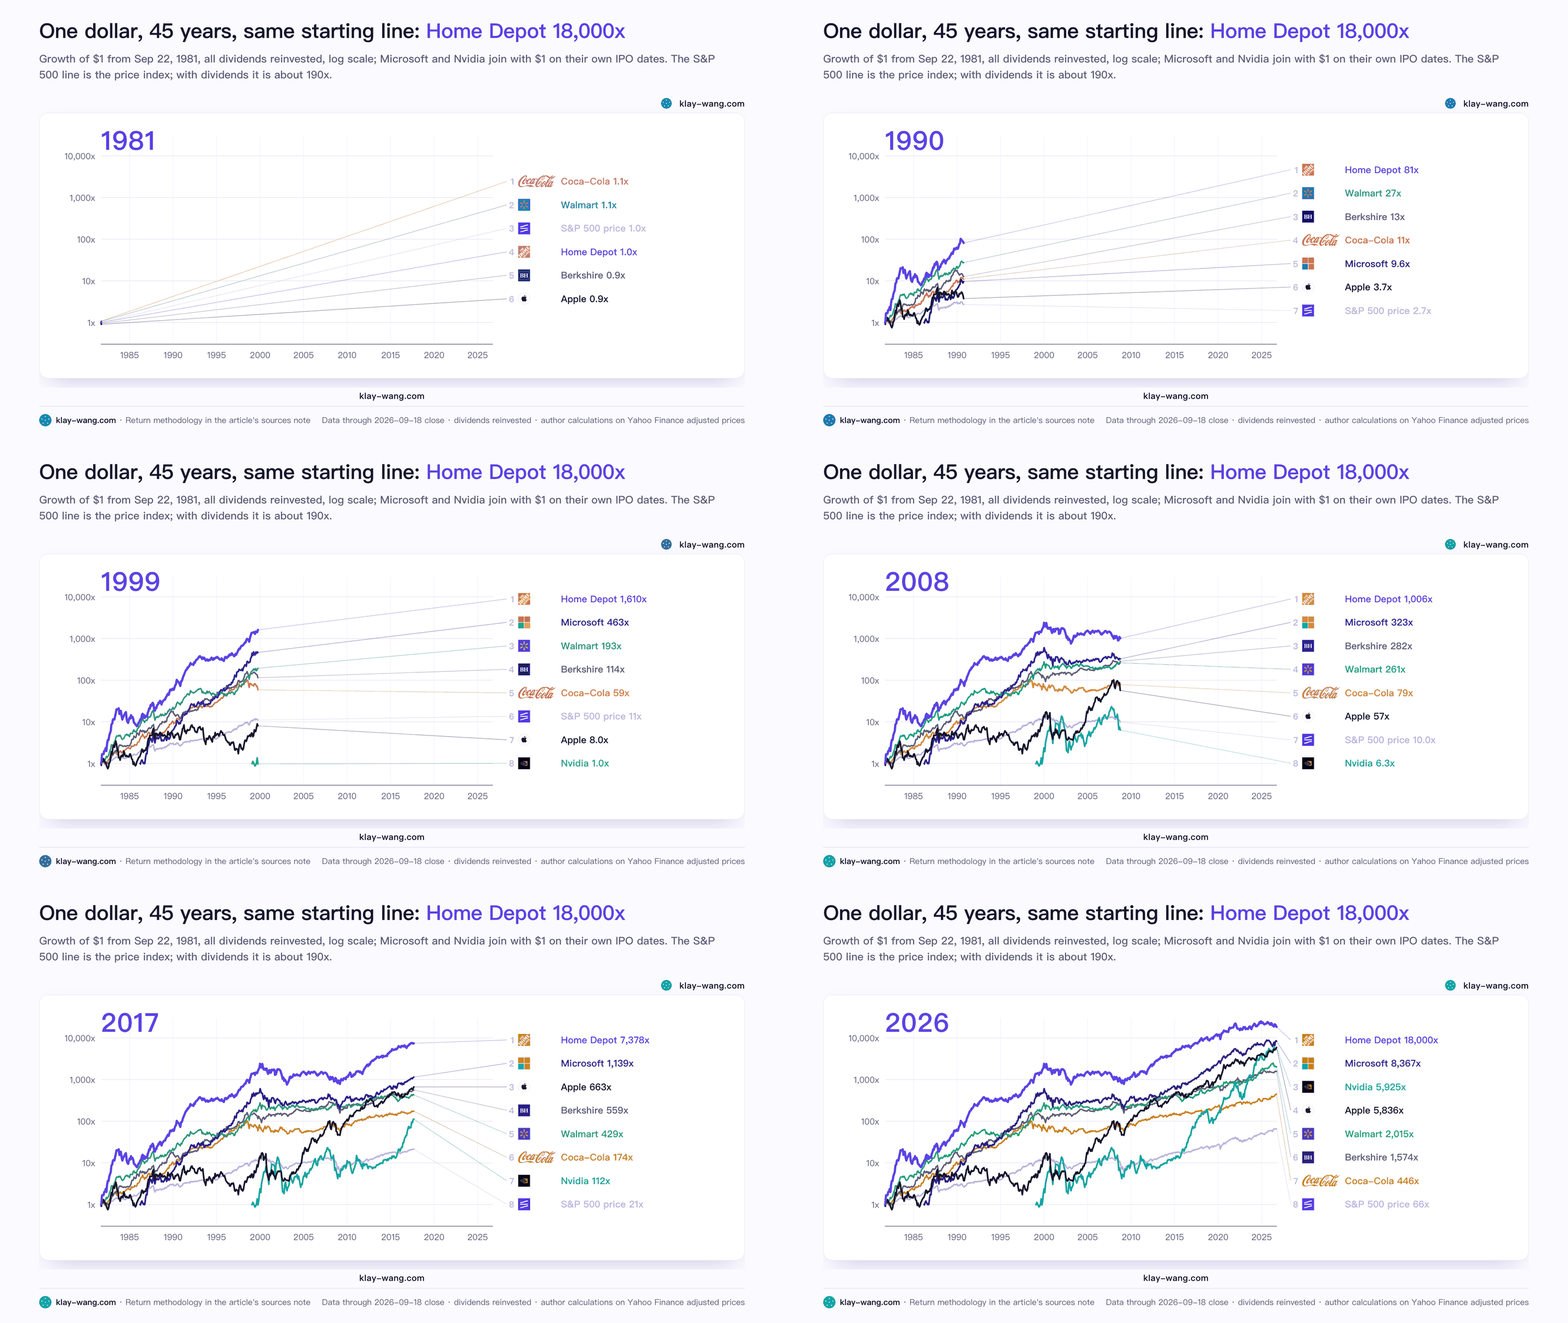
仓库代,1981 年起点。 家得宝 45 年 18305 倍,1981 年 9 月 22 日上市,四家店,募了 400 万美元,估值不到四千万,没有大投行愿意承销。它把五金店从一万平方英尺开成十万平方英尺,把毛利从 45% 砍到 30%。
软件代,1986 年起点。 微软 40 年 7875 倍,甲骨文 4016 倍。两家 1986 年 3 月 12 日和 13 日先后上市,隔一天。微软那次募了 6100 万美元,估值 7.77 亿。那几年市值榜第一是 IBM,卖硬件的,软件被当成硬件的赠品。
冷门代,1991 到 2001 年三个起点。 冠亚军是同一批人:怪物饮料、NVR、TPL、泛林、科磊、HEICO。一家做果汁的公司 2002 年推出能量饮料,一家 1992 年破产重组的建筑商,一家 1888 年铁路破产清算出来的土地信托,两家做芯片设备的,一家做飞机零件的。1996 年没有任何一份研报会把这六家放在一起。
算力代,2006 年起点,一直到今天。 英伟达 20 年 475 倍,15 年 642 倍,10 年 142 倍,三场全赢。2006 年 9 月它的股价按今天的股本折算是 0.51 美元,一家显卡公司,客户是打游戏的;同一天 Netflix 0.32 美元,还在往信箱里寄 DVD;iPhone 要到四个月后才发布。
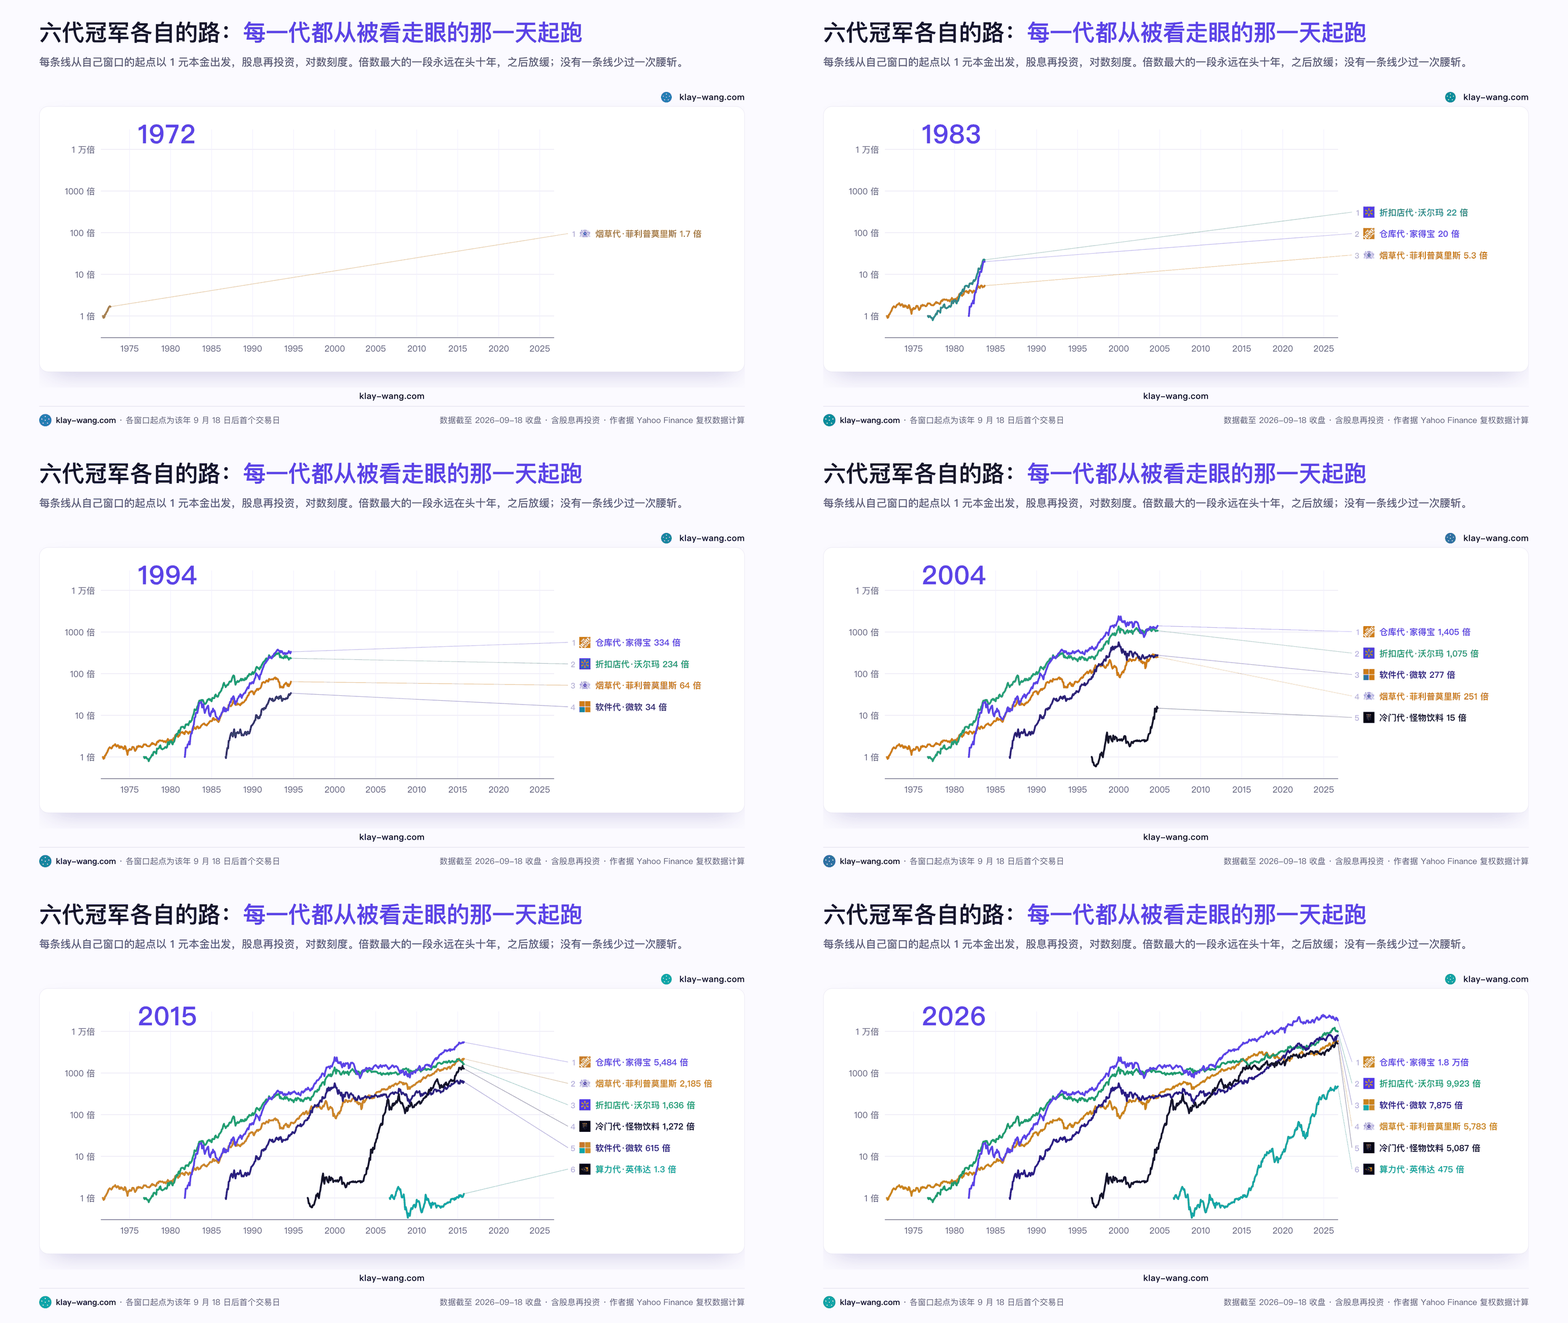
六代冠军有一个共同点:上市那天,市场给它的定位都是错的。沃尔玛是小镇杂货店,家得宝是仓库,微软是赠品,怪物是果汁,英伟达是显卡。冠军是市场看走眼之后剩下来的那一个。
每一代冠军的上市日几乎都贴着那个窗口的起点:沃尔玛 1970 年上市,50 年窗口的起点是 1976 年;家得宝 1981 年上市,45 年窗口起点就是 1981 年;微软 1986 年上市,40 年窗口起点 1986 年;英伟达 1999 年上市,2001 年是它的泡沫底。倍数最大的那段增长,永远发生在公司刚上市、市场还没搞懂它的头十年。家得宝 18305 倍里,头五年贡献了 13 倍;把起点挪到 1986 年,它从第一名掉到第九名,1390 倍。
我把这条叫起跑线定理:一只股票的历史回报,一半取决于公司,一半取决于你在它上市后第几年开始数。这条定理有一个警告,写在反方那节。
02 苹果是唯一横跨五代的公司,因为它死过一次
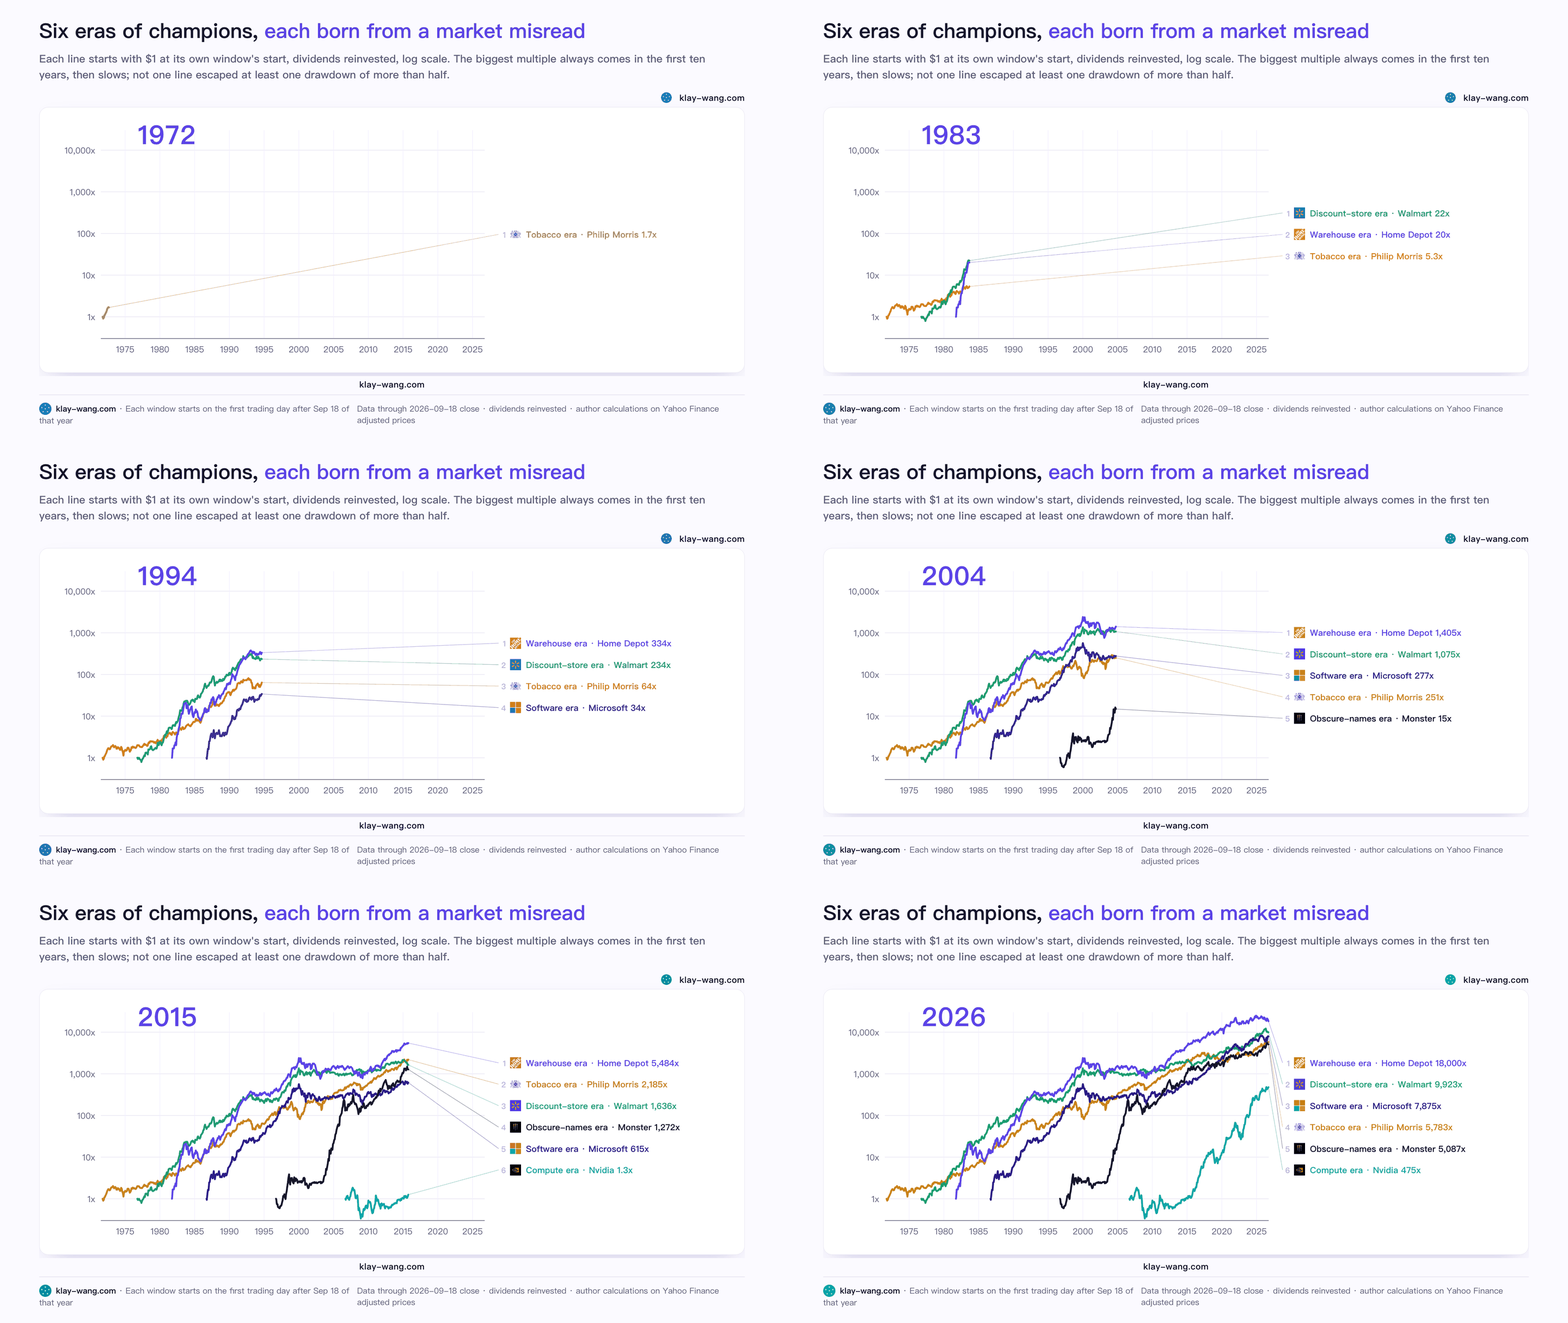
把十一张榜单的前十二名摊开,有一家公司从 1981 到 2006 年五个起点全部在前八:苹果。
- 45 年:5549 倍,第二
- 40 年:2897 倍,第五
- 35 年:942 倍,第八
- 30 年:1913 倍,第二
- 25 年:1381 倍,第二
- 20 年:152 倍,第五
它能横跨五代,原因不是它每一代都强。1996 年 9 月的苹果股价折算到今天是 0.21 美元,离破产只差几个月,1997 年乔布斯回来的时候微软给它投了 1.5 亿美元救命。以 1996 年为起点的 30 年 1913 倍,是从一家快死的公司算起的。苹果的五代,是 Mac 一代、iPod 一代、iPhone 一代、服务一代,中间隔着一次死亡。它在每一代都换了一个产品,而且换的时候上一代的产品还在赚钱。
另一家横跨的公司是家得宝,方向相反。45 年第一,40 年第九,35 年第 55,30 年第 73,25 年第 111。同一家公司,起点往后挪 25 年,从第一掉到一百名开外。它 2001 年以后 25 年只有 14 倍,年化 11%,一只普通的好股票。
苹果和家得宝放在一起,是这篇文章最想说的一件事:长期第一有两种。一种是一次爆发之后靠股息和回购慢慢滚,一种是每二十年重新爆发一次。前者需要你在起点就在,后者允许你晚来。
03 卖铲子的比淘金的活得久
榜单里还有一组名字反复出现,你可能没听过:应用材料、泛林、科磊。三家都做芯片制造设备,不做芯片。
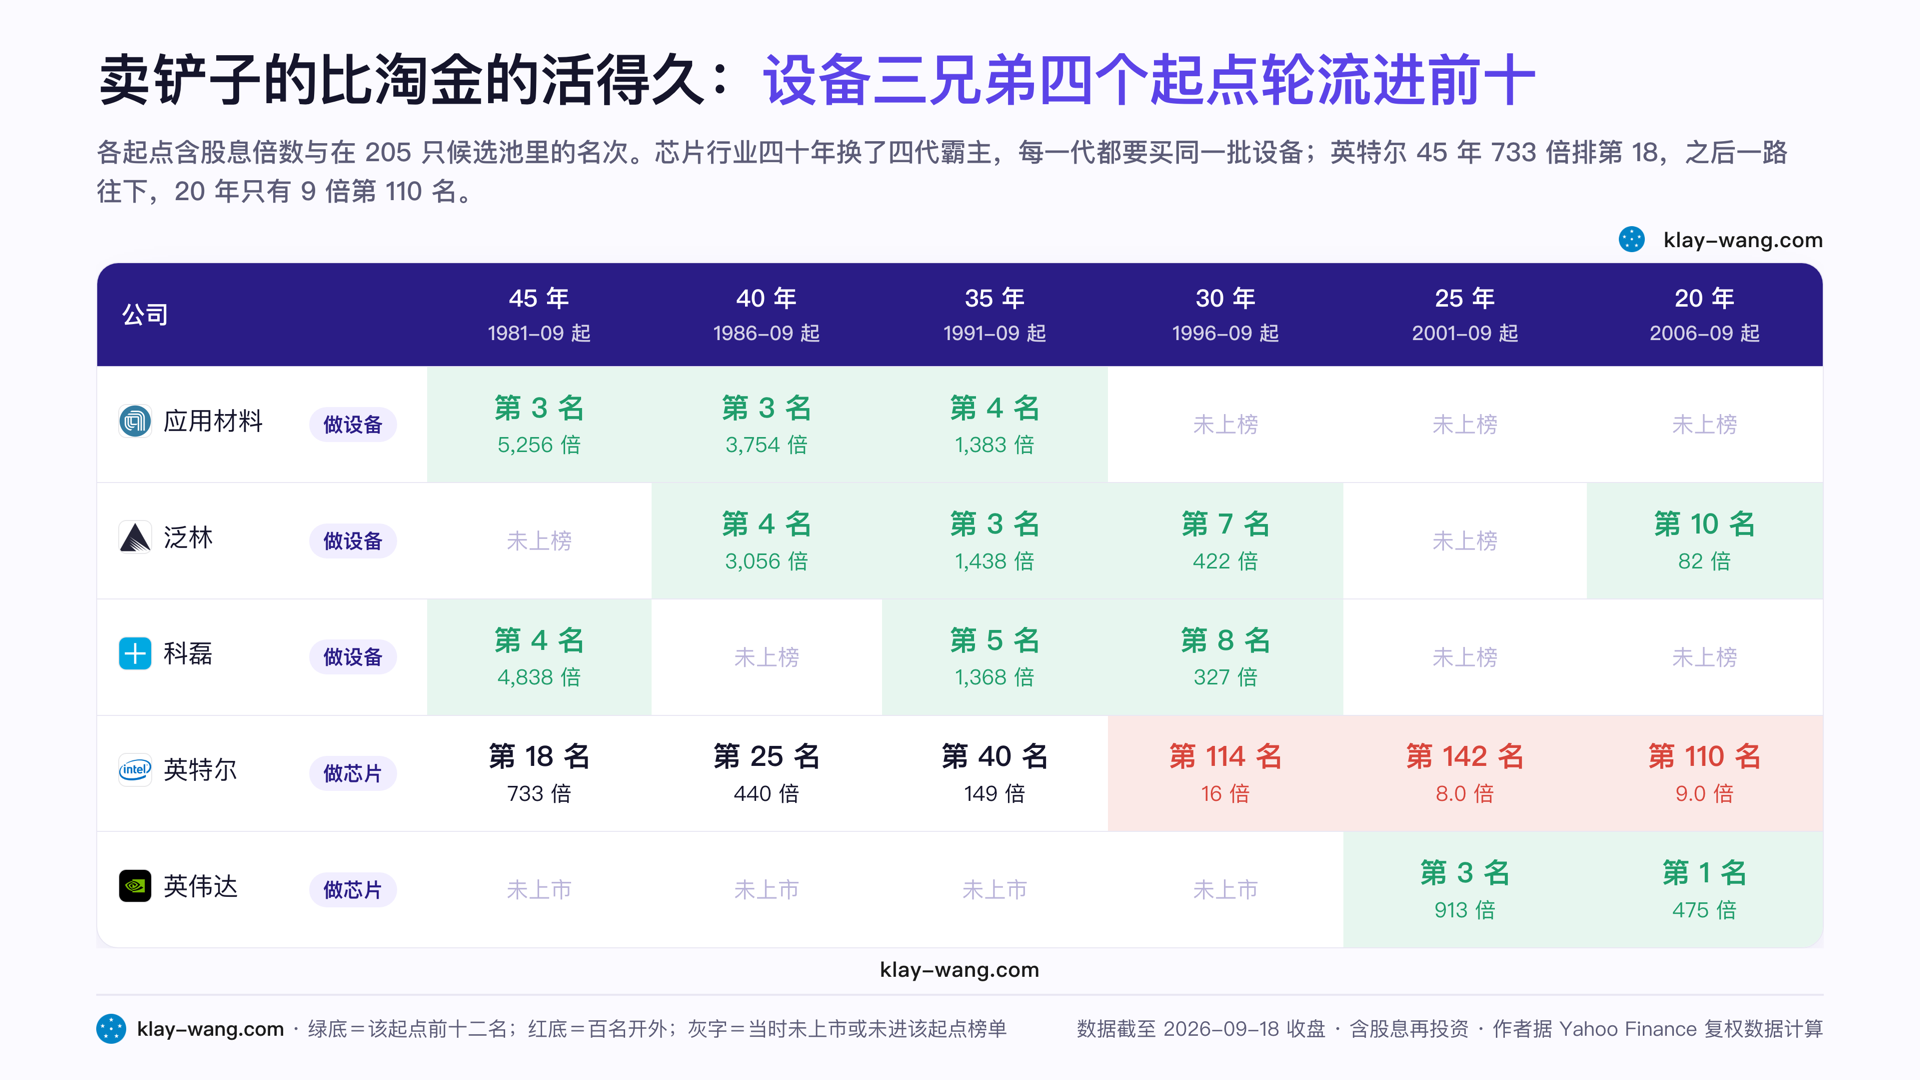
四个起点,三家公司轮流进前十。同样这四十五年,做芯片的呢?英特尔 45 年 733 倍第 18 名,40 年 440 倍第 25 名,之后一路往下,20 年只有 9 倍,第 110 名。美光进了两档前十二。英伟达只在最近三档出现。
这是我在硅谷 Fintech 观察第三篇写过的规律,卖铲子的人。淘金热里最稳的生意是卖铲子,不管谁淘到金子,铲子都得从你这买。芯片行业四十年换了四代霸主,英特尔、三星、台积电、英伟达,每一代都要买同一批设备。设备商不押谁赢,它押的是有人一直在打。
放到今天,这条规律的意思是:算力代的冠军是英伟达,但算力代活得最久的,可能是给英伟达客户装空调的。20 年榜第三、15 年榜第三都是 Comfort Systems,一家给数据中心做暖通和机电的承包商,166 倍和 196 倍。20 年榜第七 TransDigm 做飞机零件,第八 TPL 卖德州的土地和水。它们不做 AI,它们卖 AI 要用的东西。
04 股息正在从冠军名单里消失
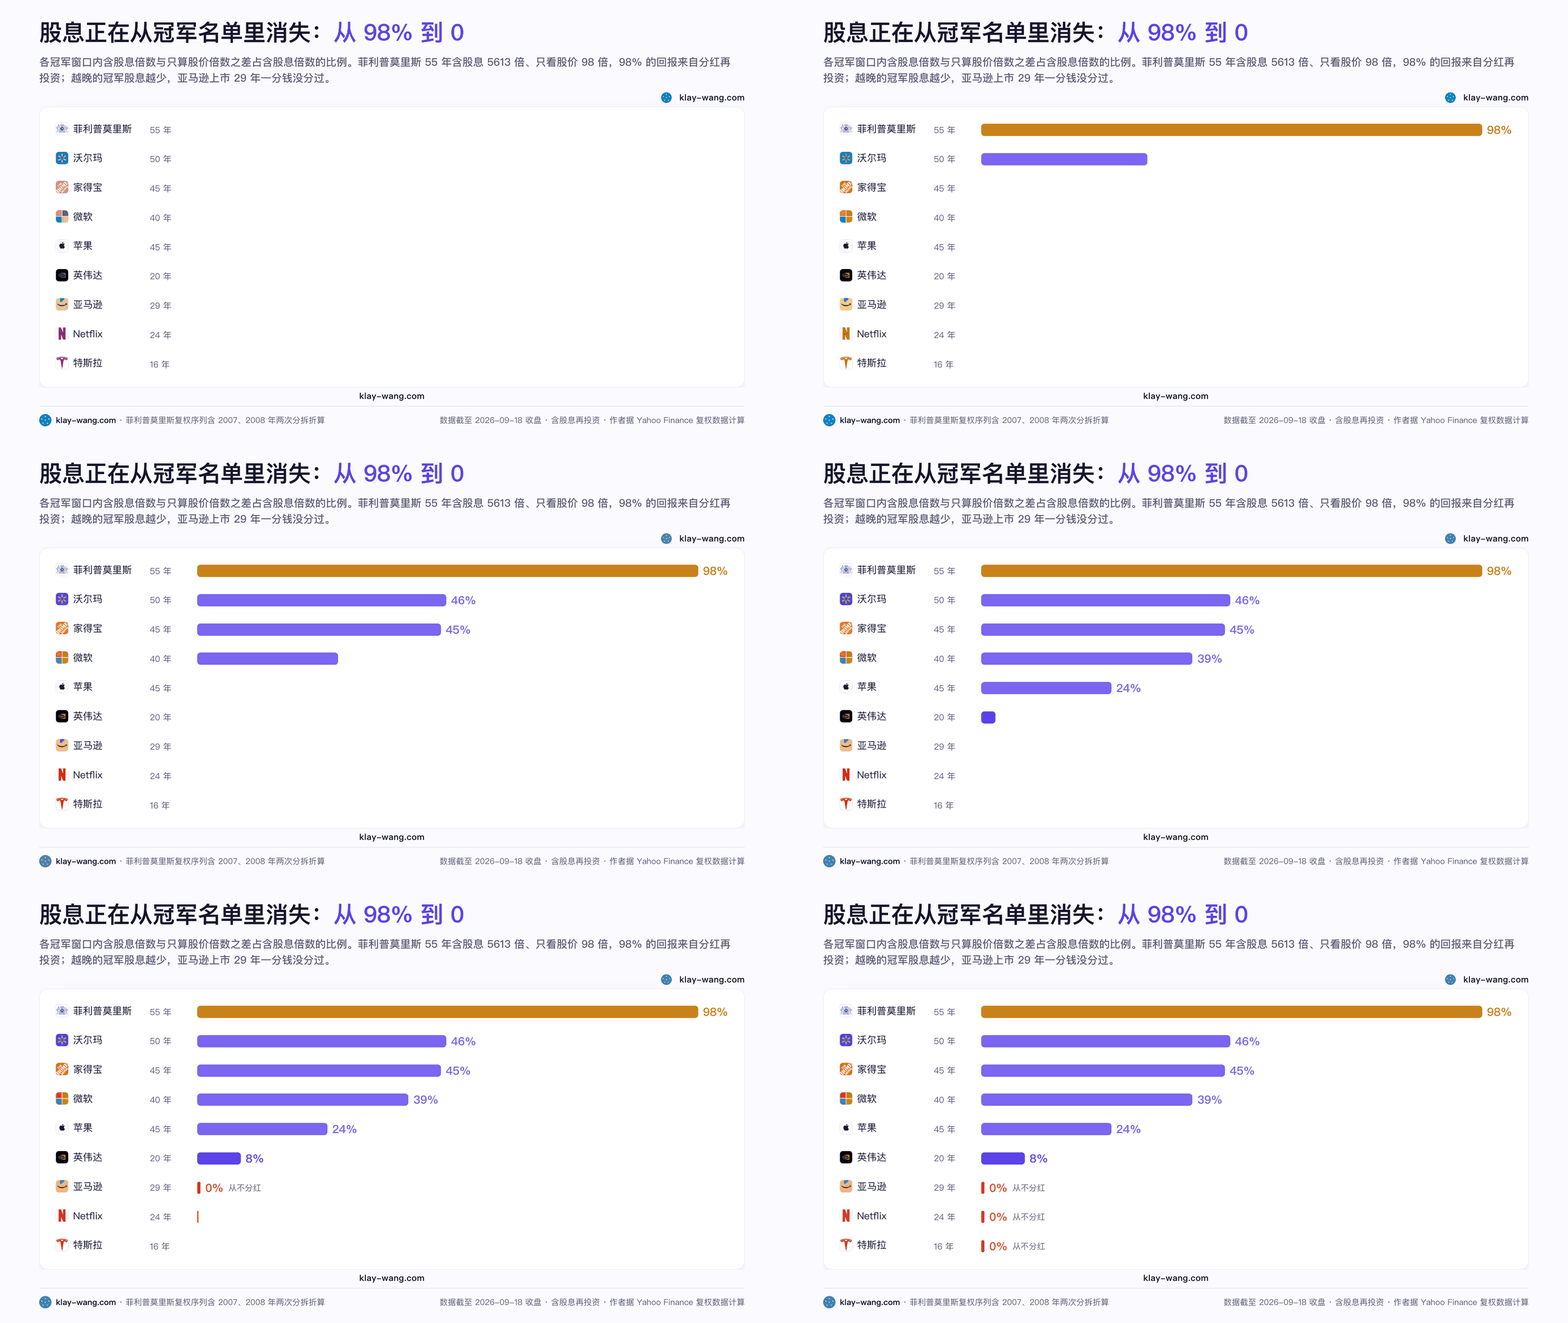
菲利普莫里斯 55 年含股息 5613 倍,只看股价 98 倍。中间差的 5515 倍全是股息再投资滚出来的,按比例算,它 98% 的回报来自分红。这是西格尔在《投资者的未来》里讲过的那只股票:1957 年到 2003 年原始标普 500 成分股里年化第一,19.75%,靠的就是每季度把烟草的现金分出来、股东再买回去。烟草公司四十年没有增长,它的股东四十年没有少赚。
把股息占比沿着榜单往下算,会看到一条清楚的线:
- 菲利普莫里斯 55 年:98%
- 沃尔玛 50 年:46%
- 家得宝 45 年:45%
- 微软 40 年:39%
- 苹果 45 年:24%
- 英伟达 20 年:8%
- 亚马逊、Netflix、特斯拉:0
越晚的冠军,股息越少。原因在于早年的冠军是成熟生意,赚了钱没地方投,只能分;晚近的冠军把每一分钱都砸回去了,亚马逊上市 29 年一分钱没分过。
这条线对普通人的含义比它看上去重要。老冠军的钱是可以拿着收的,新冠军的钱只能拿着等。1971 年买菲利普莫里斯的人,每个季度都能看到账户里多一笔现金,跌了也有钱进来,拿得住。2006 年买英伟达的人,20 年里要扛三次腰斩以上的下跌,2008 年那次跌了 85%,中间一分钱不发。倍数是同一个量级,拿住的难度完全不是。
每一代冠军在自己窗口里的最大回撤:菲利普莫里斯 65%,沃尔玛 51%,家得宝 70%,微软 69%,怪物饮料 69%,英伟达 85%,苹果 82%。没有一个冠军的路上少过一次腰斩。财富的形态变了,上一代冠军给你的是现金流,这一代冠军给你的是一张增长的期权,行权日不定,中途要扛得住。
最常被拿来反驳这一段的是两家公司,可乐和伯克希尔。
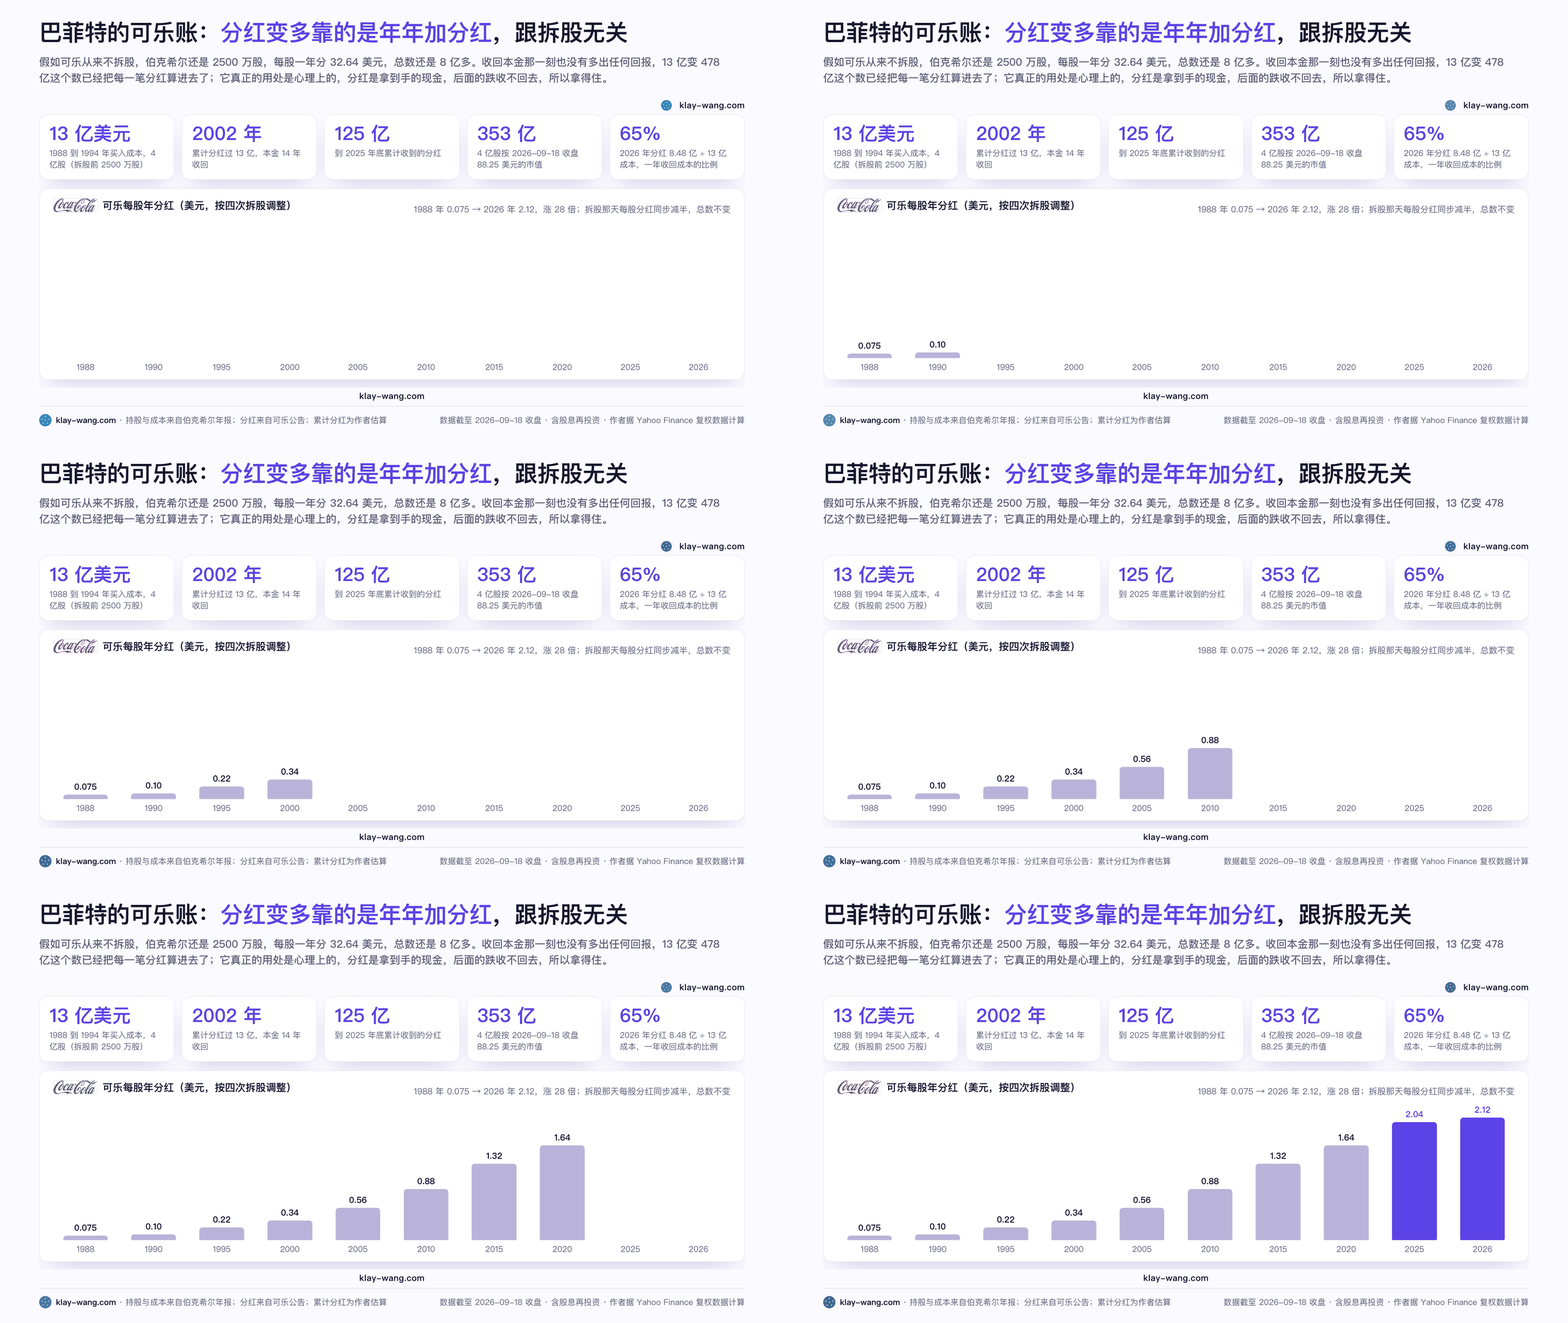
巴菲特 1988 到 1994 年花 13 亿美元买可乐,4 亿股。可乐按拆股调整的口径,1988 年每股一年分 7.5 美分,2025 年 2.04 美元,2026 年 2 月第 64 次上调到 2.12,涨了 28 倍。伯克希尔每年从可乐收到的分红,从 1989 年的三千多万涨到 2025 年的 8.16 亿,2026 年会到 8.48 亿,一年收回成本的 65%。我按逐年分红算,累计分红大约 2002 年过了 13 亿,本金 14 年收回;到 2025 年底累计约 125 亿,手里 4 亿股按 2026 年 9 月 18 日收盘值 353 亿,13 亿变 478 亿。
这笔账里常被记错的两处。一是拆股:可乐 1990、1992、1996、2012 年四次一拆二,巴菲特的股数从 2500 万变 4 亿,每股分红也同步除以 16,总分红一分没多;假如可乐从不拆股,他还是 2500 万股,每股分 32.64 美元,还是 8 亿多。二是收回本金:那个时点没有多出任何回报,478 亿这个数已经把每一笔分红算进去了。收回本金真正的用处是心理上的,分红是拿到手的现金,后面的跌收不回去,所以拿得住,这就是老冠军的钱可以拿着收的意思。
伯克希尔是反面:A 股 60 年一次不拆,一股 76 万美元,除了 1967 年那一次一毛钱之外从不分红。1965 年到 2025 年每股市值 6 万倍,年化 19.7%,同期标普含股息 461 倍。它证明的是另一半:倍数跟拆不拆股、分不分红都没关系,跟公司赚不赚钱、赚了钱怎么用有关系。可乐把钱分出来,巴菲特拿去买别的;伯克希尔把钱留下来,自己买别的。两条路都通,通的原因是同一个。
05 赢家越来越少,也越来越快
整个市场的榜首,换得更勤。
1980 年全球市值前十里六家是石油公司,剩下的是 IBM、AT&T、通用汽车、杜邦。1996 年前十是可口可乐、埃克森、英特尔、微软、通用电气、默克、IBM、宝洁、强生、沃尔玛,消费品和药厂占一半。2006 年埃克森重回第一,前十里三家银行。2026 年 9 月,前十里九家科技公司,英伟达 5.4 万亿美元第一,唯一的例外是伯克希尔,第十。
榜首换了四轮,每轮二十年上下,而且越换越快。Innosight 算过标普 500 成分股的平均在榜年限:1965 年 33 年,1990 年 20 年,2026 年的预测是 14 年。美国上市公司总数 1997 年 8800 家,2024 年底 3952 家,少了一大半。
剩下的公司里,赢家的份额还在往少数几家集中。亚利桑那州立大学的 Bessembinder 教授今年把美股一百年的账更新到 2025 年底:前十家公司创造了全部股东财富的 29%,九年前他第一次算的时候是 17.1%;七巨头一家占 24.2%;苹果一家 5.5%,英伟达 5.0%,而英伟达 1999 年才上市。上一版前十还有通用电气、IBM、通用汽车,这一版全没了,换成特斯拉和博通。
三组数说的是同一件事。市场的冠军每二十年换一批,换的速度在加快,赢家的数量在变少,每个赢家吃到的份额在变大。所以 1971 年起点的冠军年化 17%,2006 年起点的冠军年化 36%,2016 年起点的冠军年化 64%。后来的公司未必更厉害,同样的钱流进了更少的口袋,每个口袋看起来就更鼓。
06 中国的镜子:有冠军,没有生产冠军的机器
中国有没有这样的公司?有,而且单看倍数不比美国小。
网易 2001 年 9 月股价 0.6 美元,纳斯达克刚给它发了退市警告,丁磊说他不怕退市。从那天算到今天,含股息 4724 倍,年化 40%。同一个起点,美国 25 年的冠军怪物饮料是 2345 倍。腾讯 2004 年 6 月 16 日上市,3.7 港元,22 年 575 倍,年化 33%,跟英伟达 27 年的年化 37% 到 39% 是一个量级。茅台 2001 年上市,25 年 257 倍,年化 25%。格力 30 年 190 倍。
中国的冠军也符合起跑线定理,网易的起点是互联网泡沫的底,腾讯和茅台的起点是各自的上市日。
差别在表的长度和宽度。长度上,A 股 1990 年才开市,最长的窗口 35 年,那档格力 190 倍,美国同档不算 NVR 的怪物饮料是 4578 倍;港股腾讯 2004 年才来,20 年那档腾讯 133 倍,同档英伟达 475 倍;45 到 55 年那三档,中国没有参赛者。宽度上更明显:美国的榜单上苹果横跨五代,设备三兄弟横跨四代;中国的榜单上,网易、腾讯、茅台各占一个起点,没有一家公司横跨两代。二十年一换代这件事在中国只发生过一轮,就是互联网那一轮。
为什么只有一轮?公司这一层中国不缺,缺的是把公司源源不断送上榜的那台机器。美国的机器有四个齿轮,每个齿轮都能单独赚钱,所以它能一直转。
第一个齿轮是分工。从种子到 B 轮每一段都有专门的基金,投消费的、投软件的、投 fintech 的各有各的赚法。怪物饮料这种果汁公司能被投,NVR 这种破产重组的建筑商能被投,一家给数据中心装空调的承包商也能进 20 年榜前三,因为总有一类钱专门看这种东西。
第二个齿轮是退出。2025 年美国风险投资的退出,62 个 IPO 拿回 1194 亿美元,995 笔并购拿回 1127 亿美元,两条路一样宽。并购那条路的买家是大公司和 PE。上个月一个例子:8 月 4 日,夏洛特的私募基金 Axum Capital 宣布收购 BARCODE 的控股权,一个 2021 年才成立的补水饮料品牌,创始人是前尼克斯队的体能总监和库兹马,股东里有文班亚马、安东尼、哈莉·贝瑞,货已经铺进沃尔玛、7-Eleven、Kroger 和 Erewhon。五年,一家运动饮料从零到被 PE 买走。怪物饮料 2002 年推出能量饮料的时候,走的就是同一条路,只是它没被买走,自己长成了 30 年冠军。
第三个齿轮是巨头收购。苹果、微软、英伟达、可口可乐,每一家都拿现金流和低成本资本不停地买新技术、买新团队,把外面的创新变成自己的。Bessembinder 榜上前十占 29%,一部分就是这么买出来的。对 VC 来说,这是退出通道;对巨头来说,这是延寿。苹果能横跨五代,一半靠自己造,一半靠买。
第四个齿轮是指数换血。标普 500 一年换二十几家成分股,Innosight 算的平均在榜年限从 33 年降到 14 年,美国上市公司总数 1997 年以来少了一大半。老公司出去,新公司进来,指数本身在新陈代谢,所以指数六十年能拿 66 倍到 77 倍。
四个齿轮咬在一起:创业、融资、退出、钱回到早期、再创业。每一环都有人赚钱,所以每一环都有人干。
中国这台机器缺的是第二和第四个齿轮。退出长期只有 IPO 一条路,2021 年 IPO 占 VC 退出的 68%,2025 年降到 36%,剩下的并购市场刚开始长;A 股五千多家上市公司,2025 年退市 31 家,2024 年历史最高也只有 52 家,指数几乎不换血。钱进去了出不来,出不来就回不到早期,回不到早期下一轮就起不来。网易、腾讯、茅台是那台机器第一次转出来的三家公司,第二圈什么时候转、转出来什么,取决于齿轮什么时候补齐,跟公司本身的关系没那么大。
我不预测第二圈的冠军,只说一句判断:它今天大概率也在被市场看走眼,而且它能不能上榜,要看有没有人愿意在它 0.6 美元的时候接盘。
反方
先把反方说满。
第一,候选池是 205 只有名有姓的公司,不是全市场。20 到 35 年那几档的真正冠军,很可能是我根本没听过的冷门股。这张表证明的是一个方向,不是一份名次。
第二,幸存者偏差。进池的每一只都活到了今天。Bessembinder 那一百年的账里,一半以上的股票整个生命周期是亏钱的,每一代冠军背后都有几十家同一年上市、今天已经不存在的公司。1981 年买一篮子股票拿到今天,普通人真正能拿到的是标普 66 倍,不是家得宝 18305 倍。
第三,终点偏差,这一条我自己算了一遍。2026 年 9 月 18 日是 AI 行情的高位,把终点换到 2022 年 10 月 14 日,也就是这轮行情启动前的底,表就变了:20 年冠军是怪物饮料 989 倍,英伟达 172 倍掉到第八;40 年冠军变成丹纳赫 7238 倍,家得宝第二;45 年冠军是沃尔玛 3379 倍,家得宝还没上市。英伟达从 2006 年到 2022 年底部只有 24 倍,今天是 475 倍,中间的 450 倍是最近四年涨出来的。这张表每五年重算一次,冠军名单会变。
第四,口径。NVR 35 年 8201 倍是复权序列接出来的,它 1992 年破产重组,老股东被清零,没有任何一个真实股东拿到过这个倍数,所以我在表里标了有水分。菲利普莫里斯的复权序列含 2007 年和 2008 年两次分拆,98% 股息贡献那个数,一部分是分拆出去的卡夫和菲莫国际折算进来的。
回到判断。
四条反方都成立,但它们改的是名次,不是方向。冠军每二十年换一代、每代冠军上市时都被看走眼、股息在冠军里消失、赢家在集中,这四条把候选池换成全市场、把终点换到 2022 年,结论不变。
结论收窄到一句:这张表不能告诉你下一个冠军是谁,它只能告诉你下一个冠军长什么样。今天的市场给它的定位是错的,它大概率不分红,你需要拿二十年,中间会腰斩两三次。
三句话
1: 美股没有永远的冠军,起点每挪五年换一家,六十年换了六个行业。
2: 每一代冠军上市那天都被市场看走眼,倍数最大的那段永远在头十年,所以起跑线比公司重要。
3: 老冠军的钱可以拿着收,新冠军的钱只能拿着等,股息占比从 98% 降到 0,财富的形态从现金流变成了期权。
4: 中国有单个冠军,没有生产冠军的机器;差的是退出和换血两个齿轮,齿轮不补齐,第二圈转不起来。
私货
我今年 4 月写过一篇《AI 时代的反共识》,主张做千年不变的生意,人要吃饭、要住房子、要付钱,技术怎么变这些需求不变。这张表逼我把那句话修正一半。
需求确实不变。1971 年到 2026 年,人还是在抽烟、买东西、修房子、用电脑、打游戏。但满足每一种需求的公司,每二十年换一批。菲利普莫里斯的烟今天还有人抽,它已经不是冠军了;沃尔玛还是最大的零售商,它的冠军窗口在 1976 年就关上了。千年不变的是需求,二十年一换的是公司。所以新瓶装旧酒这句话要补半句:酒不换,瓶子每二十年换一次,而且换瓶子的那家公司,通常不是上一个瓶子的主人。
还有一件事我想说给自己听。十一张榜单里,我这个年纪的人真正能参与的只有 10 年到 25 年那几档,冠军是英伟达和怪物饮料。往前的那些倍数,1 万倍、5 千倍,是看的,不是拿的。所以这篇文章对我唯一的用处,是知道自己在哪个起点,然后去找那家今天被看走眼的公司,接受它不分红,接受中间腰斩,然后等。
等得起的人和等不起的人,在这张表上拿到的是两个世界。
出处与口径说明:全部倍数按 2026 年 9 月 18 日收盘,用 Yahoo Finance 日线复权序列计算,含股息再投资;起点取各窗口起始日之后第一个交易日,起点时尚未上市或数据不足的公司不进该档;候选池 205 只为作者自选的长跑股,含标普 500 里的长期赢家与部分 2006 年后上市的公司,不是全市场,60 年档因池内无一只在 1966 年前上市而为空,伯克希尔 1964 到 2025 年每股市值 6099294% 与年化 19.7%、同期标普含股息 46061% 取自伯克希尔 2025 年股东信;标普 500 表中为价格指数,不含股息,正文给的含股息倍数是按该信附表里标普逐年含股息收益率连乘并补 2026 年至 9 月 18 日涨幅的估算。可乐部分:巴菲特持股 4 亿股、成本 12.99 亿美元来自伯克希尔年报,四次拆股日期来自可乐公司股本历史,每股分红 1988 年 0.075 美元、2025 年 2.04 美元、2026 年 2.12 美元按拆股调整口径取自 Yahoo 与公司公告,8.16 亿与 8.48 亿为股数乘每股分红,累计分红约 125 亿与 2002 年收回成本为作者按拆股调整后逐年分红乘持股数估算,353 亿为 4 亿股乘 2026 年 9 月 18 日收盘 88.25 美元;伯克希尔 1967 年唯一一次分红为公开记载。终点换到 2022 年 10 月 14 日的对照表用同一候选池同一方法。家得宝 18305 倍为上市首日收盘口径,从 12 美元发行价起算为 15600 倍。最大回撤按含股息序列从各自窗口起点算起。菲利普莫里斯(今奥驰亚)复权序列含 2007 年卡夫、2008 年菲莫国际分拆的折算,98% 股息贡献含此部分;西格尔 19.75% 数据来自《投资者的未来》对 1957 到 2003 年原始标普 500 成分股的统计。NVR 1992 年破产重组前后的序列被复权数据接续,8201 倍不代表真实股东回报。IPO 募资与估值:沃尔玛 1970 年 30 万股、16.5 美元、495 万美元来自公司公告;家得宝 1981 年约 400 万美元、估值不到 4000 万来自《华尔街日报》转述 Acquired 播客;微软 1986 年 6100 万美元、估值 7.77 亿来自高盛与当年报道;苹果 1997 年获微软 1.5 亿美元投资为公开事实。中国部分:网易 2001 年 9 月起点为退市警告期间的价格,含股息 4724 倍按 Yahoo 月线复权计算;腾讯 2004 年 6 月 16 日 3.7 港元发行价来自公司公告;茅台、格力用上交所与深交所月线复权数据。市值前十各年份来自 finhacker.cz 与美国商业史中心的历史整理,1980 年为全球口径,2026 年 9 月数据截至 9 月 16 日。标普 500 成分股平均在榜年限来自 Innosight 2021 年报告,上市公司数量来自 T. Rowe Price 引用的统计。Bessembinder 2025 年更新的数字(前十占 29%、七巨头 24.2%、苹果 5.5%、英伟达 5.0%)来自彭博 2026 年对其研究的报道,一半股票亏钱来自其 2023 年论文。微软与甲骨文上市日、网易 2001 年退市警告均来自公司公告与当年报道。美国 2025 年 VC 退出(62 个 IPO 1194 亿美元、995 笔并购 1127 亿美元)来自 PitchBook 与 NVCA 的 2025 年四季度 Venture Monitor;中国 IPO 占 VC 退出比例 68%(2021)到 36%(2025)来自 Chambers 2026 年中国风险投资实务指南;A 股 2025 年退市 31 家、2024 年 52 家来自 21 世纪经济报道与新京报统计;BARCODE 交易来自 Axum Capital 2026 年 8 月 4 日公告与 Axios 报道,交易金额未披露。文中所有倍数均为历史回报,不构成任何投资建议。
First published on klay-wang.com, September 21, 2026
In brief. After finishing last week's piece on Home Depot's 16,000x over 45 years, a question surfaced: why 45 years? Move the start five years earlier and Home Depot has not listed yet; move it five years later and it drops from first to ninth. So I ran 205 well-known long-distance US stocks through every five-year starting line from 10 years to 60: eleven races. Tobacco, discount stores, hardware warehouses, software, energy drinks, chips. The champion changed seven times, across six industries. On the day each generation's champion listed, the previous generation could not make sense of it. This piece is about that table and the four things behind it: the starting line matters more than the company, shovel sellers outlive gold diggers, dividends are vanishing from the list of champions, and the winners are getting fewer and faster. The last section is about China: we have individual champions; what we lack is the machine that produces them.
About 7,500 words. Give it at least 18 minutes.
There is no permanent champion in US stocks, only a champion for each starting line. Move the start five years and first place goes to a different company, and with it a different industry.
The table below is my own calculation. The 205 candidates are all well-known long-distance stocks that are still alive today, measured to a common end date of September 18, 2026 with dividends reinvested, using Yahoo Finance's adjusted series. The 60-year bracket has no candidate at all, because the only companies I know of that listed before 1966 and survive today are Berkshire and a few old tobacco and oil names, so I filled in Berkshire's figure with the official number from Buffett's letter.
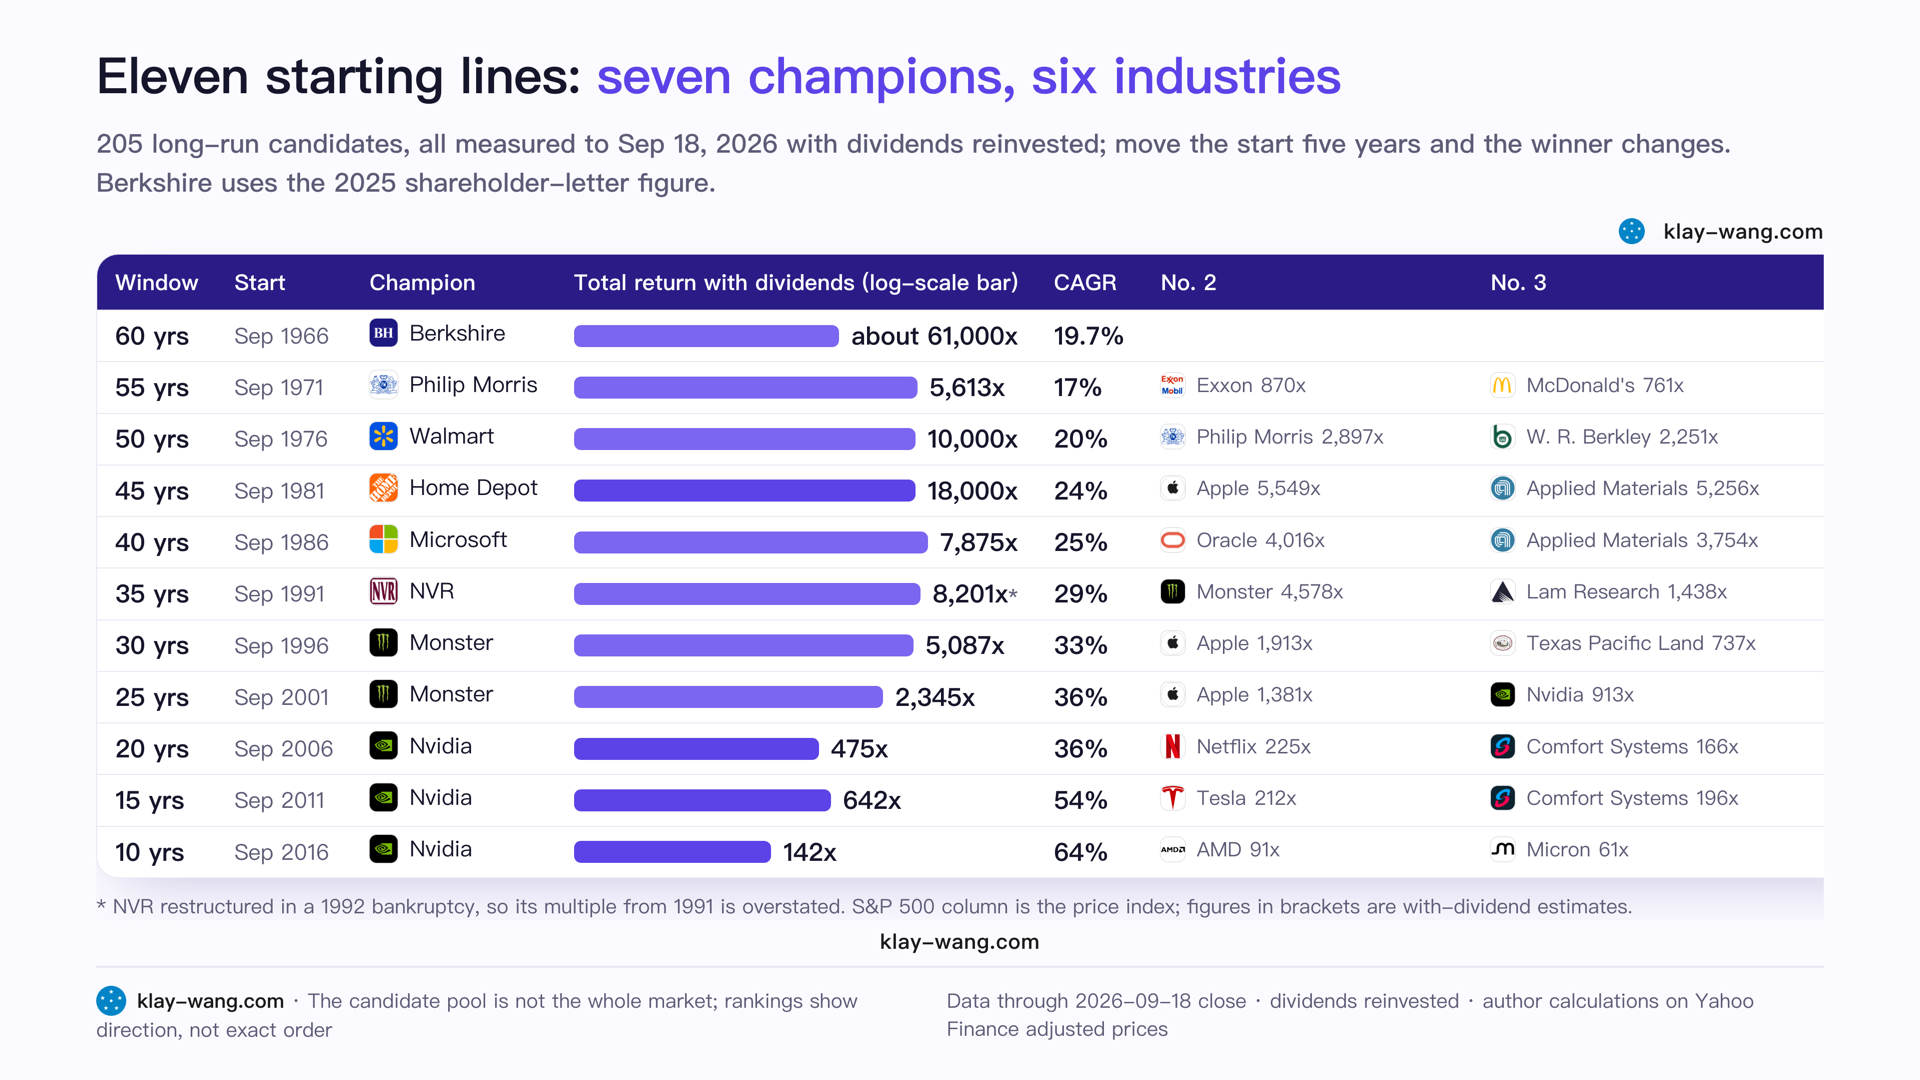
Eleven starting lines, seven different champions. Nvidia won the last three races, Home Depot won only the 45-year race, Monster Beverage won two. Going back, every race was won by a company nobody favored in the race before.
The S&P column in the table is the price index, without dividends. Reinvest them and it is about 190x from 1981, 65x from 1986, 16x from 1996, 7x from 2006, two to three times the figures in the table. That is the number to measure the gap between champion and index against.
01 On the day each champion listed, the previous generation could not make sense of it
I grouped the starting lines into generations by industry, and pinned a listing date to each.
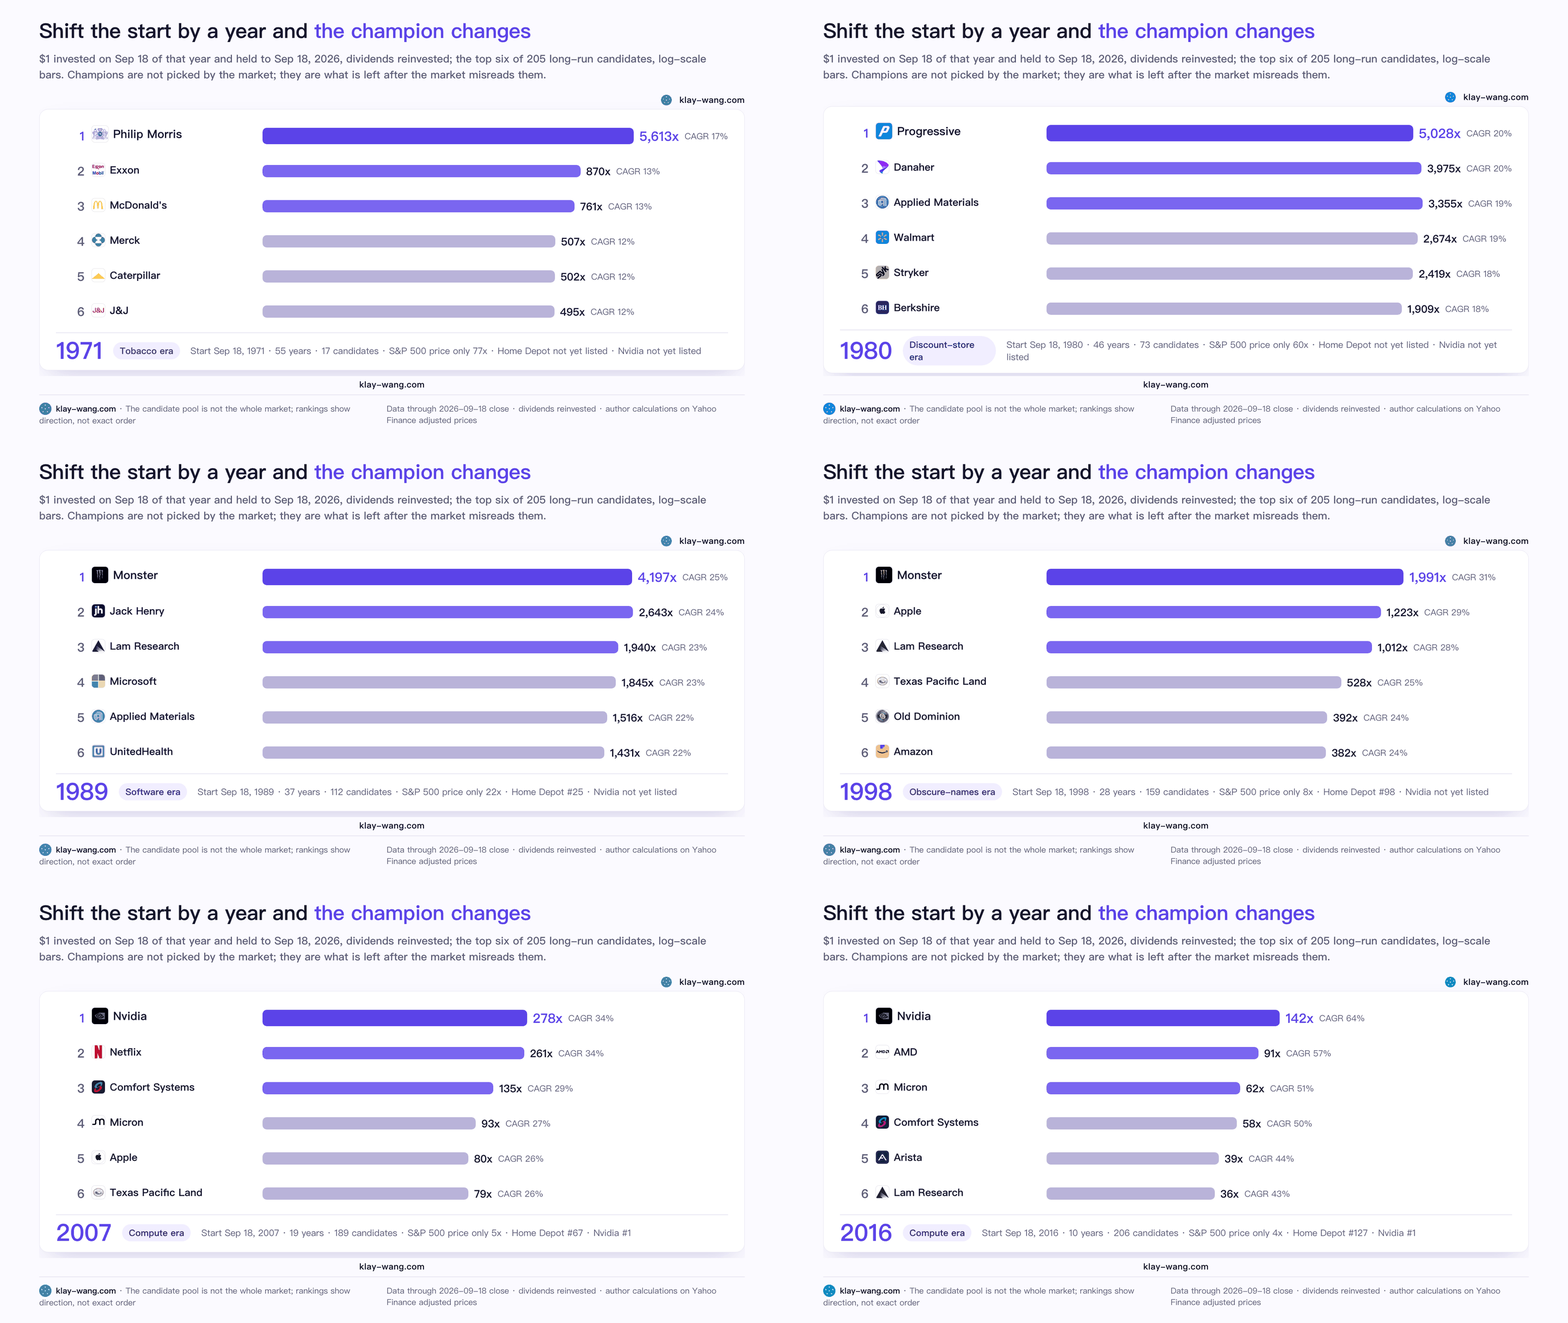
The tobacco generation, 1971 start. Philip Morris, 5,613x over 55 years, 17% a year. It had no growth story; Americans were already smoking in 1971. Its secret waits for section 04. For now, one number: on price alone, only 98x in 55 years.
The discount-store generation, 1976 start. Walmart, 10,260x over 50 years. It listed on October 1, 1970, 300,000 shares at $16.50, $4.95 million raised in total, an Arkansas company that opened in the small towns the big chains would not touch.
The warehouse generation, 1981 start. Home Depot, 18,305x over 45 years. It listed on September 22, 1981 with four stores, raised $4 million, was valued at under $40 million, and no big investment bank would underwrite it. It turned the 10,000-square-foot hardware store into a 100,000-square-foot one and cut gross margin from 45% to 30%.
The software generation, 1986 start. Microsoft, 7,875x over 40 years; Oracle, 4,016x. The two listed a day apart, on March 12 and 13, 1986. Microsoft raised $61 million at a valuation of $777 million. The biggest company by market value in those years was IBM, a hardware seller, and software was treated as something thrown in with the hardware.
The obscure-names generation, three starts from 1991 to 2001. The winners and runners-up are the same crowd: Monster Beverage, NVR, Texas Pacific Land, Lam Research, KLA, HEICO. A juice company that launched an energy drink in 2002, a homebuilder that went through bankruptcy in 1992, a land trust that came out of an 1888 railroad liquidation, two makers of chip equipment, a maker of aircraft parts. No research report in 1996 would have put those six names together.
The compute generation, 2006 start to today. Nvidia: 475x over 20 years, 642x over 15, 142x over 10, three races out of three. In September 2006 its share price, adjusted to today's share count, was $0.51, a graphics-card company whose customers played games; Netflix the same day was $0.32 and still mailing DVDs; the iPhone would not be announced for another four months.
The six generations of champions share one thing: on the day each listed, the market had it wrong. Walmart was a small-town general store, Home Depot a warehouse, Microsoft a throw-in, Monster a juice, Nvidia a graphics card. The champion is whatever is left after the market misreads it.
One more observation. Each generation's champion listed almost right at its window's starting line: Walmart listed in 1970 and the 50-year window starts in 1976; Home Depot listed in 1981 and the 45-year window starts in 1981; Microsoft listed in 1986 and the 40-year window starts in 1986; Nvidia listed in 1999 and 2001 was its bubble bottom. The stretch with the biggest multiple always comes in the first ten years after listing, while the market still has not worked the company out. Of Home Depot's 18,305x, the first five years contributed 13x; move the start to 1986 and it drops from first to ninth, at 1,390x.
I call this the starting-line theorem: a stock's historical return is half the company and half which year after listing you start counting. The theorem comes with a warning, which is in the section on the other side.
02 Apple is the only company across five generations, because it died once
Spread out the top twelve from all eleven lists and one company is in the top eight at all five starting lines from 1981 to 2006: Apple.
- 45 years: 5,549x, second
- 40 years: 2,897x, fifth
- 35 years: 942x, eighth
- 30 years: 1,913x, second
- 25 years: 1,381x, second
- 20 years: 152x, fifth
It spans five generations not because it was strong in every one. Apple's share price in September 1996, adjusted to today, was $0.21, a few months from bankruptcy; when Jobs came back in 1997, Microsoft put in $150 million to keep it alive. The 1,913x over 30 years from a 1996 start is counted from a company that was about to die. Apple's five generations are the Mac generation, the iPod generation, the iPhone generation and the services generation, with one death in between. In every generation it changed product, and it changed while the previous product was still making money.
The other company that spans generations is Home Depot, in the opposite direction. First over 45 years, ninth over 40, 55th over 35, 73rd over 30, 111th over 25. Same company, move the start 25 years later, and it goes from first to outside the top hundred. Over the 25 years since 2001 it is only 14x, 11% a year, an ordinary good stock.
Apple and Home Depot side by side are the thing this piece most wants to say: there are two kinds of long-run first. One is a single burst followed by a slow roll on dividends and buybacks; the other re-ignites every twenty years. The first requires you to be there at the start. The second lets you arrive late.
03 Shovel sellers outlive gold diggers
There is another group of names that keeps appearing on the lists that you may never have heard of: Applied Materials, Lam Research, KLA. All three make the equipment that makes chips. None makes chips.
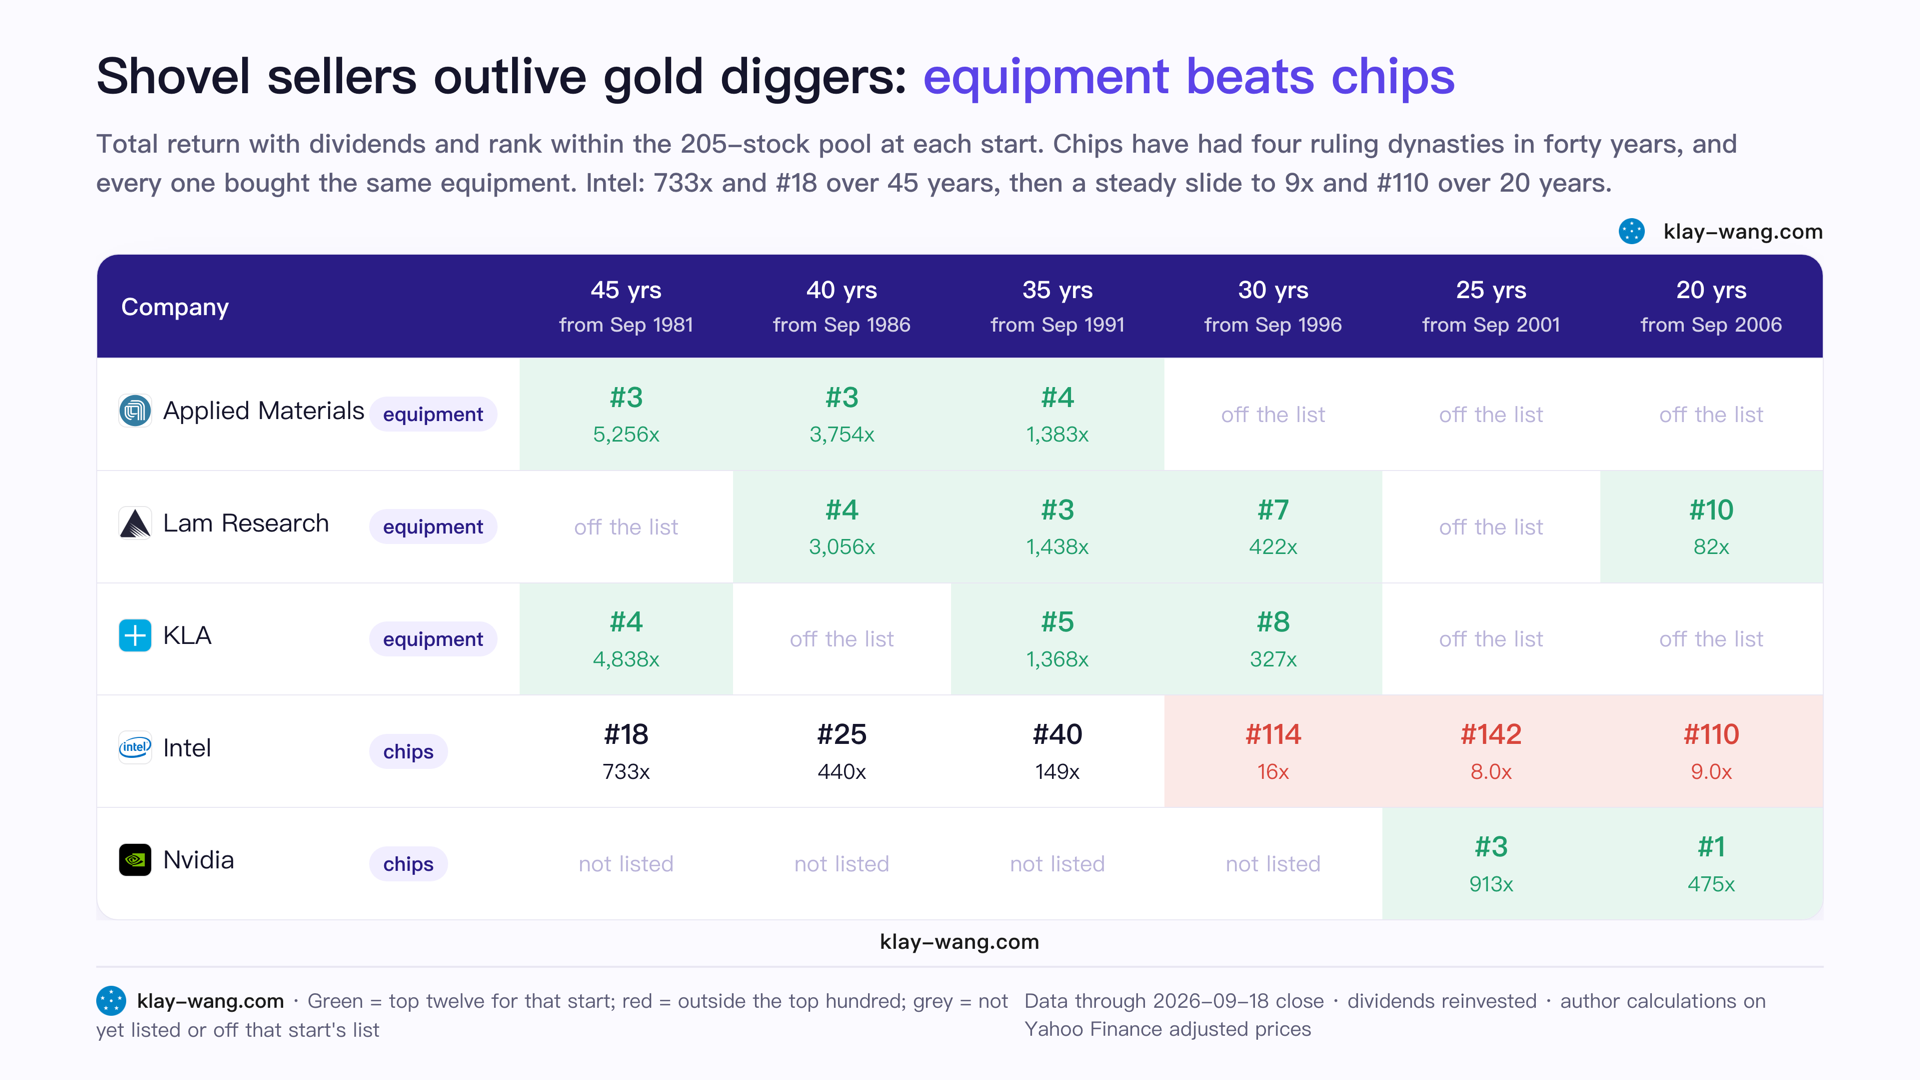
Four starting lines, and the three take turns in the top ten. Over the same 45 years, what about the chipmakers? Intel: 733x and 18th over 45 years, 440x and 25th over 40, then a steady slide to 9x and 110th over 20. Micron made the top twelve in two brackets. Nvidia appears only in the last three.
This is a pattern I wrote about in the third piece of my Silicon Valley fintech series: the people who sell shovels. The steadiest business in a gold rush is selling shovels; whoever finds the gold, they buy the shovel from you. The chip industry has had four ruling dynasties in forty years, Intel, Samsung, TSMC, Nvidia, and every one bought the same equipment. The equipment makers do not bet on who wins. They bet that someone keeps fighting.
Applied to today, the pattern says: the champion of the compute generation is Nvidia, but the longest-lived company of the compute generation may be the one installing air conditioning for Nvidia's customers. Third on the 20-year list and third on the 15-year list is Comfort Systems, a contractor that does HVAC and mechanical work for data centers, 166x and 196x. Seventh on the 20-year list is TransDigm, aircraft parts; eighth is Texas Pacific Land, selling land and water in Texas. They do not do AI. They sell what AI needs.
04 Dividends are vanishing from the list of champions
Now the 98x.
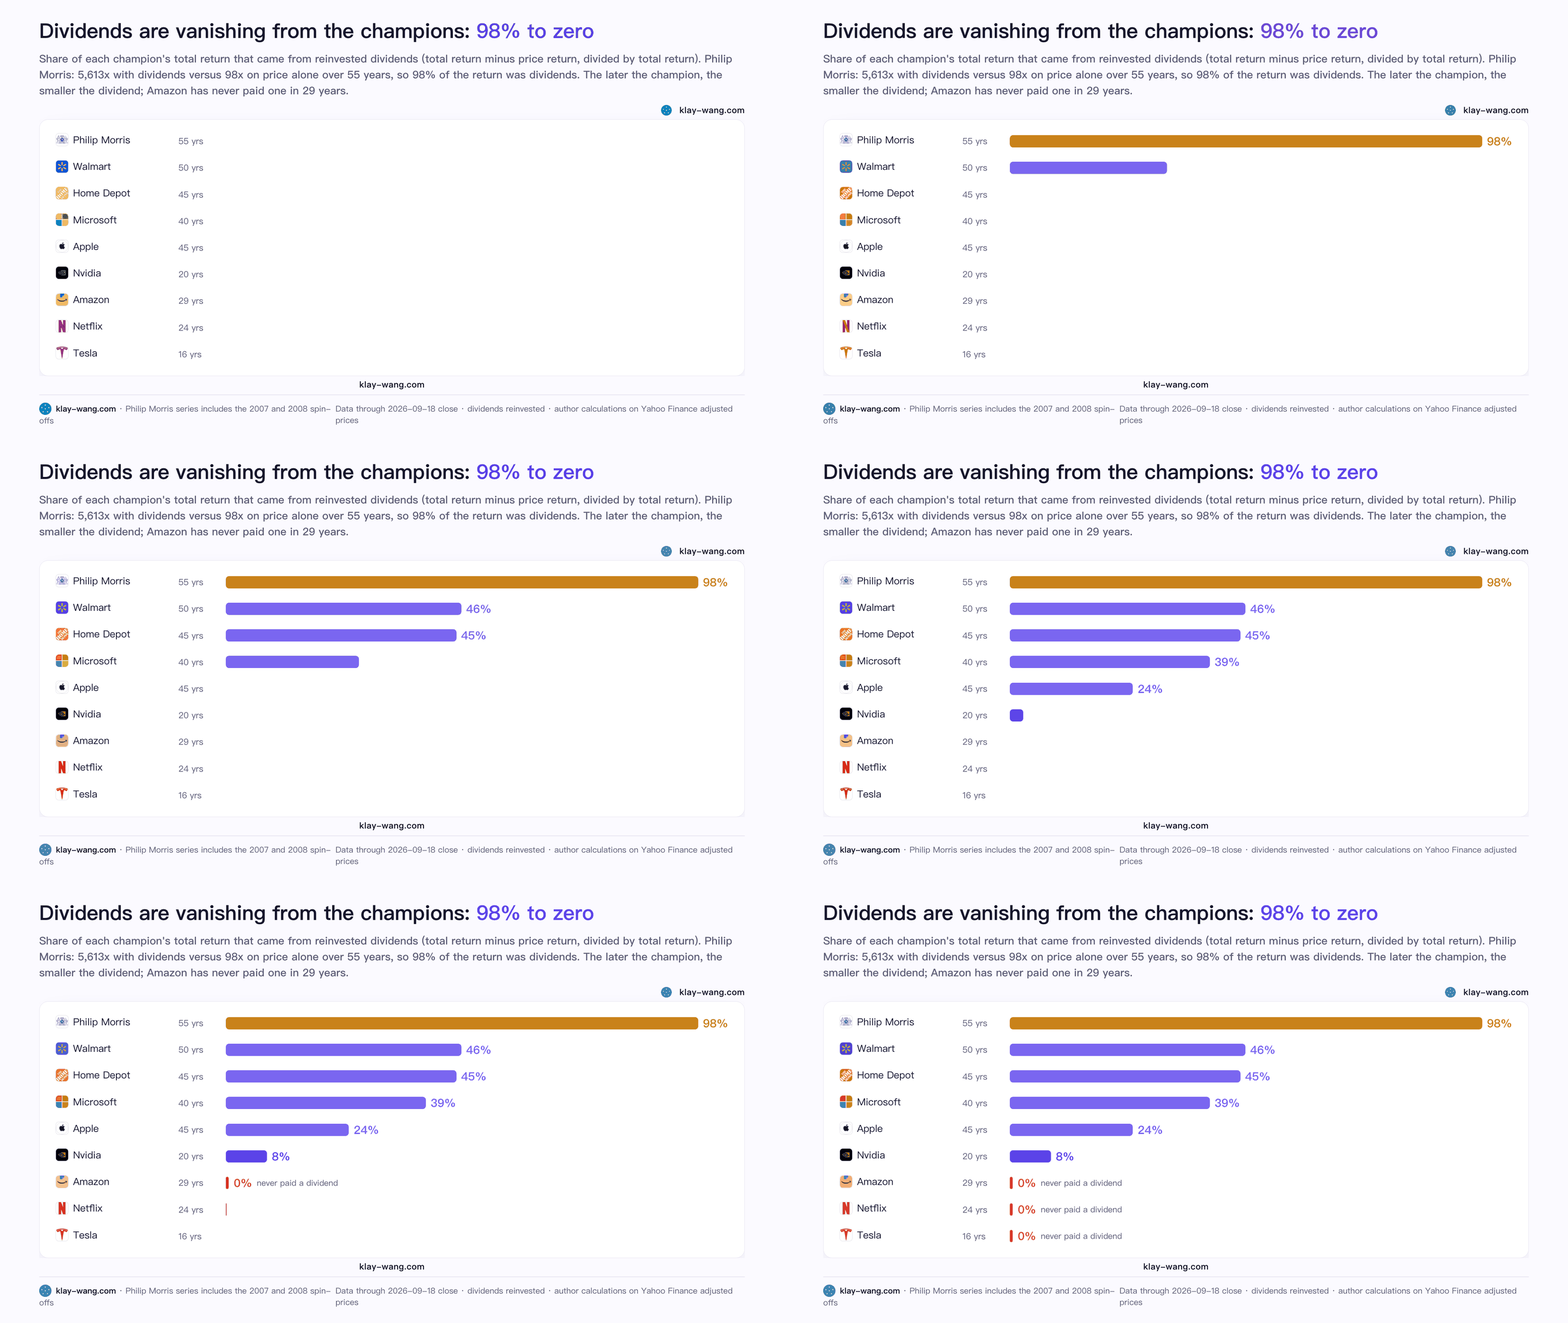
Philip Morris is 5,613x over 55 years with dividends and 98x on price alone. The 5,515x in between is entirely reinvested dividends rolling up; proportionally, 98% of its return came from the payout. This is the stock Siegel wrote about in The Future for Investors: the best annual return among the original 1957 S&P 500 constituents through 2003, 19.75%, earned by paying out the tobacco cash every quarter and having shareholders buy it back in. The tobacco company had no growth for forty years, and its shareholders earned no less for forty years.
Run the dividend share down the list and a clear line appears:
- Philip Morris, 55 years: 98%
- Walmart, 50 years: 46%
- Home Depot, 45 years: 45%
- Microsoft, 40 years: 39%
- Apple, 45 years: 24%
- Nvidia, 20 years: 8%
- Amazon, Netflix, Tesla: 0
The later the champion, the smaller the dividend. The early champions were mature businesses with nowhere to invest what they earned, so they paid it out; the recent champions put every cent back in. Amazon has not paid a dividend in 29 years as a public company.
This line means more for ordinary people than it looks. The money of the old champions could be held and collected; the money of the new champions can only be held and waited for. Someone who bought Philip Morris in 1971 saw cash arrive in the account every quarter, money coming in even when the stock fell, and could hold on. Someone who bought Nvidia in 2006 had to sit through three falls of more than half in 20 years, 85% in the 2008 one, without a cent paid out in between. The multiples are the same order of magnitude. The difficulty of holding is not remotely.
While I am at it, here is the worst drawdown of each generation's champion inside its own window: Philip Morris 65%, Walmart 51%, Home Depot 70%, Microsoft 69%, Monster 69%, Nvidia 85%, Apple 82%. Not one champion's road was short of at least one halving. The shape of wealth has changed: the last generation's champion gave you cash flow, this generation's gives you an option on growth, with no fixed exercise date and a lot to endure on the way.
Two companies need to be set out separately here, because they are the ones most often raised against the paragraph above: Coca-Cola and Berkshire.
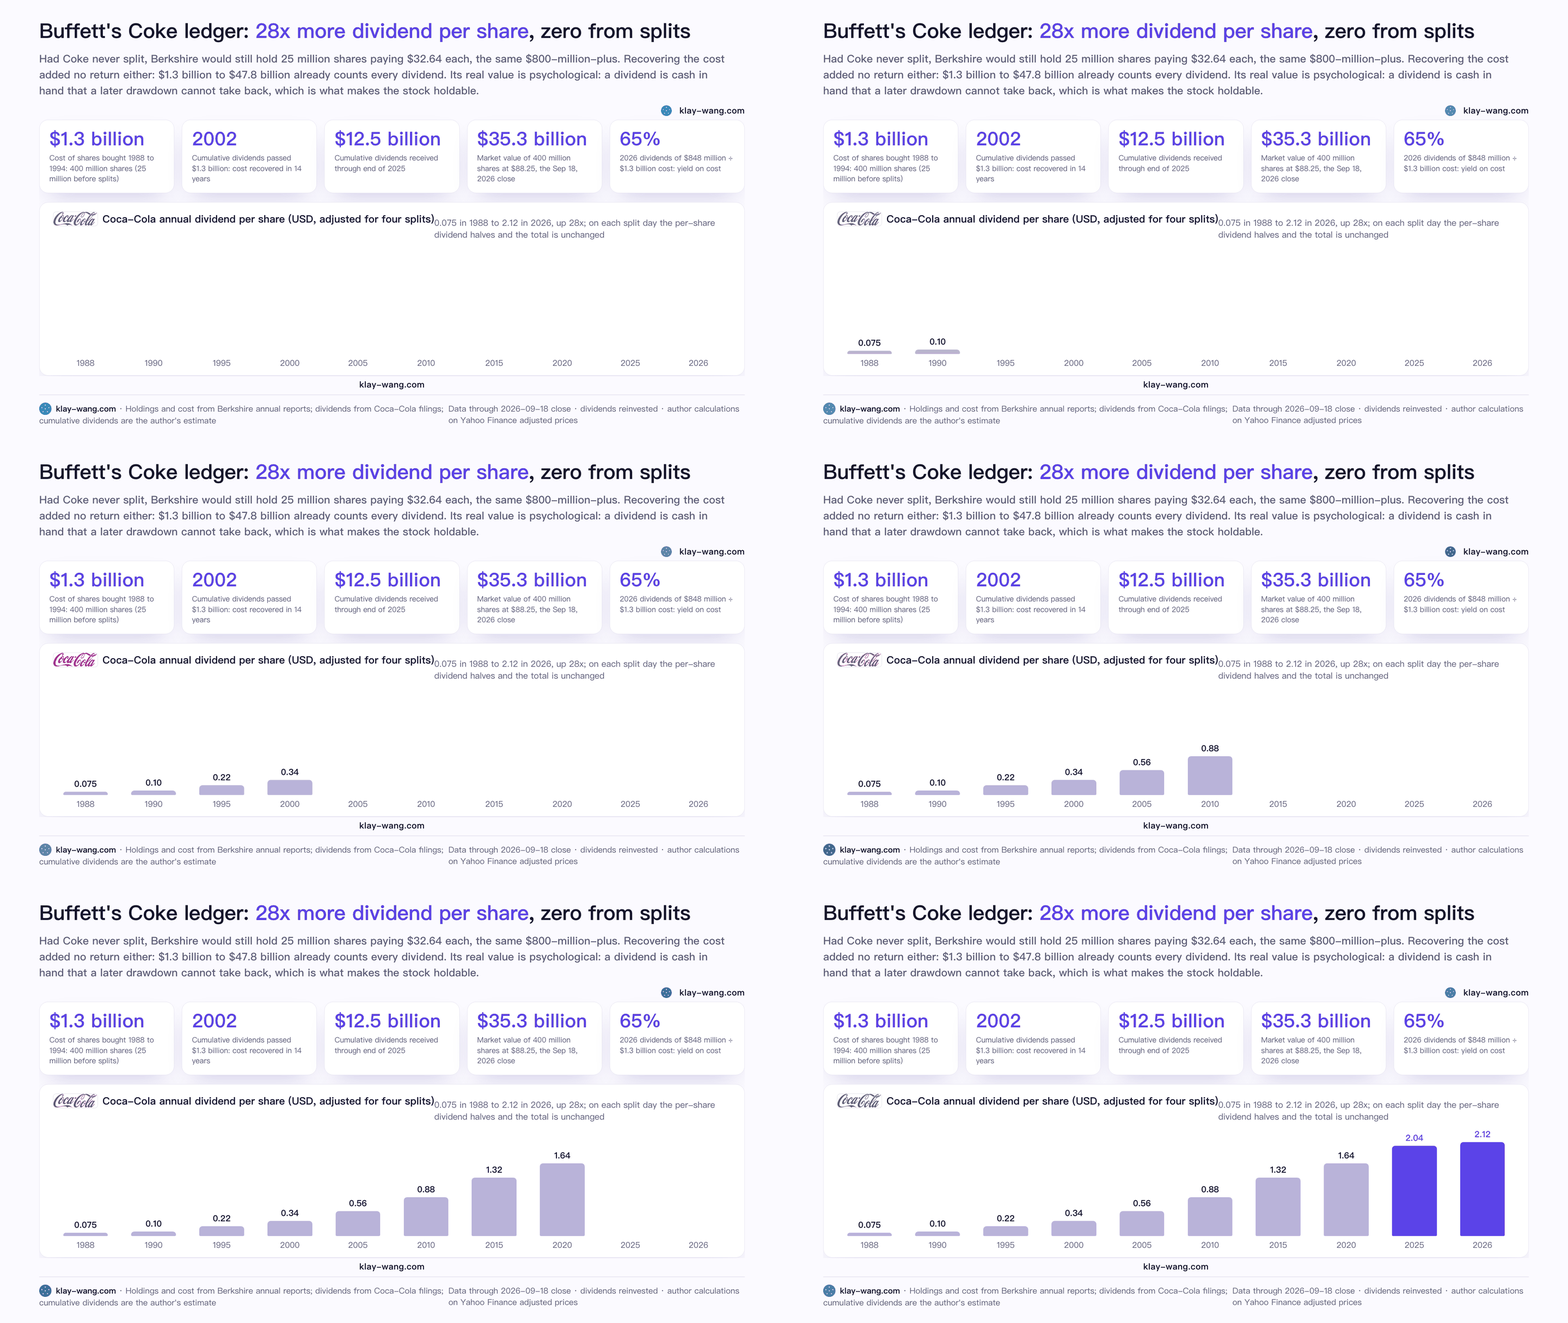
From 1988 to 1994 Buffett paid $1.3 billion for Coca-Cola, 400 million shares. Split-adjusted, Coca-Cola paid 7.5 cents a share for the year in 1988 and $2.04 in 2025, and in February 2026 it raised the dividend for the 64th time, to $2.12: 28x. The dividends Berkshire collects from Coca-Cola each year went from thirty-odd million dollars in 1989 to $816 million in 2025 and will be $848 million in 2026, 65% of the cost recovered in a single year. Going through the dividends year by year, the cumulative total passed $1.3 billion around 2002, so the cost came back in 14 years; through the end of 2025 it is roughly $12.5 billion, and the 400 million shares are worth $35.3 billion at the September 18, 2026 close. $1.3 billion to $47.8 billion.
Two things in that ledger are commonly misremembered. One is the splits: Coca-Cola split two-for-one four times, in 1990, 1992, 1996 and 2012, and Buffett's share count went from 25 million to 400 million while the dividend per share was divided by 16 in step, so the total dividend did not rise by a cent; had Coca-Cola never split, he would still hold 25 million shares paying $32.64 each, still $800-million-plus. The other is cost recovery: at that moment no return appeared out of nowhere, and the $47.8 billion already counts every dividend. The real use of recovering your cost is psychological: a dividend is cash in hand that a later fall cannot take back, so you can hold on. That is what it means to say the money of the old champions could be held and collected.
Berkshire is the mirror image: the A shares have not split once in 60 years, one share is $760,000, and apart from a single ten-cent payment in 1967 it has never paid a dividend. Per-share market value from 1965 to 2025 is 60,000x, 19.7% a year, against 461x for the S&P with dividends over the same period. It proves the other half: the multiple has nothing to do with whether a company splits or pays out, and everything to do with whether it makes money and what it does with it. Coca-Cola pays the money out and Buffett buys other things with it; Berkshire keeps the money and buys other things itself. Both roads work, and they work for the same reason.
05 The winners are getting fewer, and faster
Step out one more level, to the whole market.
In 1980, six of the ten most valuable companies in the world were oil companies; the rest were IBM, AT&T, General Motors and DuPont. The 1996 top ten was Coca-Cola, Exxon, Intel, Microsoft, General Electric, Merck, IBM, P&G, Johnson & Johnson and Walmart, half consumer goods and pharma. In 2006 Exxon was back on top and three of the ten were banks. In September 2026, nine of the top ten are tech companies, Nvidia first at $5.4 trillion, and the only exception is Berkshire, tenth.
The top of the table has turned over four times, roughly every twenty years, and each turn comes faster. Innosight calculated the average tenure of an S&P 500 constituent: 33 years in 1965, 20 years in 1990, and a forecast of 14 years for 2026. The number of listed US companies went from 8,800 in 1997 to 3,952 at the end of 2024, more than halved.
Among the companies that remain, the share taken by the winners keeps concentrating in a handful. Professor Bessembinder of Arizona State updated his century of US stock accounts through the end of 2025 this year: the top ten companies created 29% of all shareholder wealth, against 17.1% when he first ran the numbers nine years ago; the Magnificent Seven alone account for 24.2%; Apple alone 5.5%, Nvidia 5.0%, and Nvidia only listed in 1999. The previous edition's top ten still had General Electric, IBM and General Motors; this edition has none of them, replaced by Tesla and Broadcom.
These three sets of numbers say the same thing. The market's champions change every twenty years, the change is speeding up, the number of winners is shrinking, and each winner's share is growing. So the 1971 champion earned 17% a year, the 2006 champion 36%, the 2016 champion 64%. The later companies are not necessarily better. The same money is flowing into fewer pockets, and each pocket looks fuller.
06 China's mirror: champions, but no machine that produces champions
Does China have companies like this? Yes, and on multiples alone they are no smaller than America's.
NetEase was $0.60 in September 2001, just after Nasdaq sent it a delisting warning, and Ding Lei said he was not afraid of being delisted. From that day to today it is 4,724x with dividends, 40% a year. From the same start, the American 25-year champion, Monster Beverage, is 2,345x. Tencent listed on June 16, 2004 at HK$3.70 and is 575x over 22 years, 33% a year, the same order as Nvidia's 37% to 39% over 27. Moutai listed in 2001 and is 257x over 25 years, 25% a year. Gree is 190x over 30 years.
China's champions obey the starting-line theorem too: NetEase's start was the bottom of the dot-com bust, and Tencent's and Moutai's were their own listing days.
The difference is in the length and width of the table. Length: the A-share market only opened in 1990, so the longest window is 35 years, where Gree's 190x compares with 4,578x for Monster in the same American bracket (leaving NVR aside); Tencent only arrived in Hong Kong in 2004, and in the 20-year bracket its 133x compares with Nvidia's 475x; in the 45- to 55-year brackets China has no entrant at all. Width is even more telling: on the American lists Apple spans five generations and the three equipment makers span four; on the Chinese lists NetEase, Tencent and Moutai each hold one starting line, and no company spans two generations. The twenty-year turnover has happened exactly once in China, the internet round.
Why only once? China is not short of companies at the company level. What it lacks is the machine that keeps sending companies up the list. The American machine has four gears, and each gear makes money on its own, so it keeps turning.
The first gear is specialization. From seed to Series B, every stage has dedicated funds, and consumer investors, software investors and fintech investors each have their own way of making money. A juice company like Monster can get funded, a homebuilder out of bankruptcy like NVR can get funded, and a contractor installing air conditioning in data centers can reach third on the 20-year list, because there is always a class of money that looks at exactly that kind of thing.
The second gear is exit. In 2025, American venture exits took back $119.4 billion through 62 IPOs and $112.7 billion through 995 acquisitions, two roads of equal width. The buyers on the acquisition road are large companies and private equity. An example from last month: on August 4, Charlotte-based private-equity firm Axum Capital announced it was buying a controlling stake in BARCODE, a hydration-drink brand founded only in 2021 by a former Knicks strength coach and Kyle Kuzma, with Victor Wembanyama, Carmelo Anthony and Halle Berry among its shareholders, and its product already on the shelves at Walmart, 7-Eleven, Kroger and Erewhon. Five years, a sports drink from zero to bought out by PE. When Monster launched its energy drink in 2002 it walked the same road; it just was not bought, and grew into a 30-year champion on its own.
The third gear is acquisition by the giants. Apple, Microsoft, Nvidia, Coca-Cola: each uses its cash flow and cheap capital to keep buying new technology and new teams, turning outside innovation into its own. Part of the 29% held by Bessembinder's top ten was bought this way. For the VC it is an exit; for the giant it is a life extension. Apple spans five generations half by building and half by buying.
The fourth gear is index turnover. The S&P 500 swaps out twenty-odd constituents a year, Innosight's average tenure has fallen from 33 years to 14, and the number of listed US companies has more than halved since 1997. Old companies out, new companies in: the index itself metabolizes, which is why the index can return 66x to 77x over sixty years.
The four gears mesh: start, fund, exit, money returns to the early stage, start again. Someone makes money at every link, so someone works at every link.
What China's machine lacks is the second and fourth gears. For a long time the only exit was an IPO: IPOs were 68% of VC exits in 2021 and 36% in 2025, and the acquisition market that makes up the rest is only beginning to grow. The A-share market has more than five thousand listed companies, 31 delisted in 2025, and even the record year of 2024 saw only 52; the index barely turns over. Money goes in and cannot get out; if it cannot get out it cannot return to the early stage; if it cannot return to the early stage the next round cannot start. NetEase, Tencent and Moutai are the three companies the machine produced on its first turn. When the second turn comes, and what it produces, depends on when the gears are completed, and has less to do with the companies themselves.
I will not predict the second turn's champion. One judgment only: it is very likely being misread by the market today, and whether it makes the list depends on whether someone is willing to buy it at $0.60.
The other side
Let me make the opposing case in full first.
First, the candidate pool is 205 named companies, not the whole market. The true champions of the 20- to 35-year brackets may well be obscure stocks I have never heard of. What this table proves is a direction, not a ranking.
Second, survivorship bias. Every stock in the pool survived to today. In Bessembinder's century of accounts, more than half of all stocks lost money over their whole lives, and behind each generation's champion are dozens of companies that listed the same year and no longer exist. Buy a basket of stocks in 1981 and hold to today, and what an ordinary person actually gets is the S&P's 66x, not Home Depot's 18,305x.
Third, endpoint bias, and this one I ran myself. September 18, 2026 is a high point in the AI rally. Move the endpoint to October 14, 2022, the bottom before this rally began, and the table changes: the 20-year champion is Monster at 989x, and Nvidia drops to eighth at 172x; the 40-year champion becomes Danaher at 7,238x, with Home Depot second; the 45-year champion is Walmart at 3,379x, with Home Depot not yet listed. From 2006 to the 2022 bottom, Nvidia was only 24x; today it is 475x, and the 450x in between was made in the last four years. Recompute this table every five years and the list of champions will change.
Fourth, definitions. NVR's 8,201x over 35 years is spliced together from an adjusted series; it went through bankruptcy in 1992, the old shareholders were wiped out, and no real shareholder ever got that multiple, which is why it carries an asterisk in the table. Philip Morris's adjusted series includes the 2007 and 2008 spin-offs, so part of the 98% dividend share is the spun-off Kraft and Philip Morris International folded back in.
Back to the judgment.
All four objections stand, but they change the rankings, not the direction. The champion changes every twenty years, every generation's champion is misread at listing, dividends are vanishing from the champions, the winners are concentrating: swap the pool for the whole market, move the endpoint to 2022, and those four hold.
Narrowed to one sentence: this table cannot tell you who the next champion is. It can only tell you what the next champion looks like. The market has it wrong today, it very likely pays no dividend, you will need to hold it for twenty years, and it will halve two or three times along the way.
Three sentences
1: There is no permanent champion in US stocks; move the start five years and the winner changes, and sixty years changed six industries.
2: Every generation's champion was misread by the market on the day it listed, and the biggest stretch of the multiple always comes in the first ten years, so the starting line matters more than the company.
3: The money of the old champions could be held and collected; the money of the new champions can only be held and waited for. The dividend share went from 98% to zero, and wealth changed shape from cash flow to an option.
4: China has individual champions but no machine that produces them. What is missing is the exit gear and the turnover gear, and until they are fitted the second turn cannot start.
My own two cents
In April this year I wrote a piece called The Contrarian View for the AI Era, arguing for businesses that have not changed in a thousand years: people need to eat, to live somewhere, to pay, and however the technology changes those needs do not. This table forces me to revise half of that.
The needs really do not change. From 1971 to 2026, people still smoke, shop, fix houses, use computers, play games. But the company that serves each need changes every twenty years. People still smoke Philip Morris's cigarettes, and it is no longer the champion; Walmart is still the biggest retailer, and its championship window closed in 1976. What does not change in a thousand years is the need; what changes every twenty is the company. So the old wine in new bottles line needs half a sentence added: the wine stays, the bottle changes every twenty years, and the company that changes the bottle is usually not the owner of the last one.
One more thing, said to myself. Of the eleven lists, the only brackets someone my age can actually take part in are the 10- to 25-year ones, where the champions are Nvidia and Monster. The multiples before that, 10,000x, 5,000x, are for looking at, not for holding. So the only use of this piece to me is to know which starting line I am on, then go and find the company the market is misreading today, accept that it pays no dividend, accept that it will halve along the way, and wait.
Those who can afford to wait and those who cannot get two different worlds out of this table.
Sources and definitions: All multiples are at the September 18, 2026 close, computed from Yahoo Finance daily adjusted series with dividends reinvested; each window starts on the first trading day after its start date, and companies not yet listed or without sufficient data at the start are excluded from that bracket. The 205-stock pool is the author's own selection of long-distance stocks, including long-run winners in the S&P 500 and some companies listed after 2006, and is not the whole market; the 60-year bracket is empty because nothing in the pool listed before 1966. Berkshire's per-share market value gain of 6,099,294% from 1964 to 2025, its 19.7% annual rate, and the S&P's 46,061% with dividends over the same period are from Berkshire's 2025 shareholder letter. The S&P 500 in the table is the price index without dividends; the with-dividend multiples in the text are estimates from chaining the S&P's annual total returns in that letter's appendix and adding 2026 through September 18. Coca-Cola: Buffett's 400 million shares and $1.299 billion cost are from Berkshire's annual reports; the four split dates are from Coca-Cola's share history; dividends per share of $0.075 in 1988, $2.04 in 2025 and $2.12 in 2026, split-adjusted, are from Yahoo and company announcements; $816 million and $848 million are shares times dividend per share; cumulative dividends of about $12.5 billion and cost recovery in 2002 are the author's estimate from split-adjusted annual dividends times shares held; $35.3 billion is 400 million shares times the September 18, 2026 close of $88.25; Berkshire's single 1967 dividend is a matter of public record. The comparison table with the endpoint moved to October 14, 2022 uses the same pool and method. Home Depot's 18,305x is from the first day's close; from the $12 offer price it is 15,600x. Worst drawdowns are computed on the with-dividend series from each window's start. Philip Morris (now Altria) has an adjusted series that folds in the 2007 Kraft and 2008 Philip Morris International spin-offs, and the 98% dividend share includes that; Siegel's 19.75% is from The Future for Investors, on the original 1957 S&P 500 constituents through 2003. NVR's series before and after the 1992 bankruptcy is spliced by the adjusted data, and 8,201x does not represent a real shareholder return. IPO proceeds and valuations: Walmart's 300,000 shares at $16.50 for $4.95 million in 1970 are from company announcements; Home Depot's roughly $4 million and valuation under $40 million in 1981 are from the Wall Street Journal's retelling of the Acquired podcast; Microsoft's $61 million and $777 million valuation in 1986 are from Goldman Sachs and contemporary reports; Microsoft's $150 million investment in Apple in 1997 is a matter of public record. China: NetEase's September 2001 start is the price during the delisting-warning period, and 4,724x with dividends is computed from Yahoo monthly adjusted data; Tencent's HK$3.70 offer price on June 16, 2004 is from company announcements; Moutai and Gree use monthly adjusted data from the Shanghai and Shenzhen exchanges. Top-ten market values by year are from historical compilations by finhacker.cz and the Center for American Business History; 1980 is on a global basis, and September 2026 data are as of September 16. Average S&P 500 constituent tenure is from Innosight's 2021 report; listed-company counts are from statistics cited by T. Rowe Price. Bessembinder's 2025 update (top ten at 29%, Magnificent Seven 24.2%, Apple 5.5%, Nvidia 5.0%) is from Bloomberg's 2026 coverage of his research; half of stocks losing money is from his 2023 paper. Microsoft's and Oracle's listing dates and NetEase's 2001 delisting warning are from company announcements and contemporary reports. 2025 US venture exits (62 IPOs for $119.4 billion, 995 acquisitions for $112.7 billion) are from the PitchBook-NVCA Venture Monitor for Q4 2025; the IPO share of Chinese VC exits, 68% in 2021 to 36% in 2025, is from the Chambers 2026 China venture capital practice guide; A-share delistings of 31 in 2025 and 52 in 2024 are from 21st Century Business Herald and Beijing News tallies; the BARCODE transaction is from Axum Capital's August 4, 2026 announcement and Axios reporting, with the price undisclosed. All multiples in this piece are historical returns and do not constitute investment advice.
Comments留言