美股 45 年最会赚钱的股票,是一家卖钉子的The Best-Performing US Stock of the Last 45 Years Sells Nails
A web original — first published here on September 21, 2026.本文 2026.09.21 首发于本站。
目录Contents
- 01 Two fired middle-aged men and a used Cadillac
- 02 Nearly dead in 1985, then 35x in ten years
- 03 Even the best stock can go 13 years without rising
- 04 Seventeen years without new stores, revenue up 2.3x
- 05 Half the money came from the most boring part
- 06 What Chinese readers may not know: it lost badly in China
- 07 The return rankings are a game of definitions
- The other side: is this company still worth looking at
- Three sentences
- My own two cents
本文 2026 年 9 月 21 日首发于 klay-wang.com
导读| 1981 年 9 月 22 日,一家只有四家店的亚特兰大五金仓库在场外市场挂牌,发行价 12 美元,华尔街没人想要。45 年后,当年投进去的 1000 美元,含股息再投资,变成了 1600 万美元。同一时期买苹果的,拿到 400 万。这家公司叫家得宝,卖钉子、木板、马桶和油漆。它在中国开过 12 家店,六年亏完,2012 年撤得干干净净,走的时候三个高管还被扣了 80 个小时。为什么一门在中国做不成的生意,在美国能做成 45 年回报最高的股票?我把 45 年的账翻了一遍,答案跟你想的不一样。
全文约 6500 字,阅读时长建议不小于 15 分钟,建议读两遍。
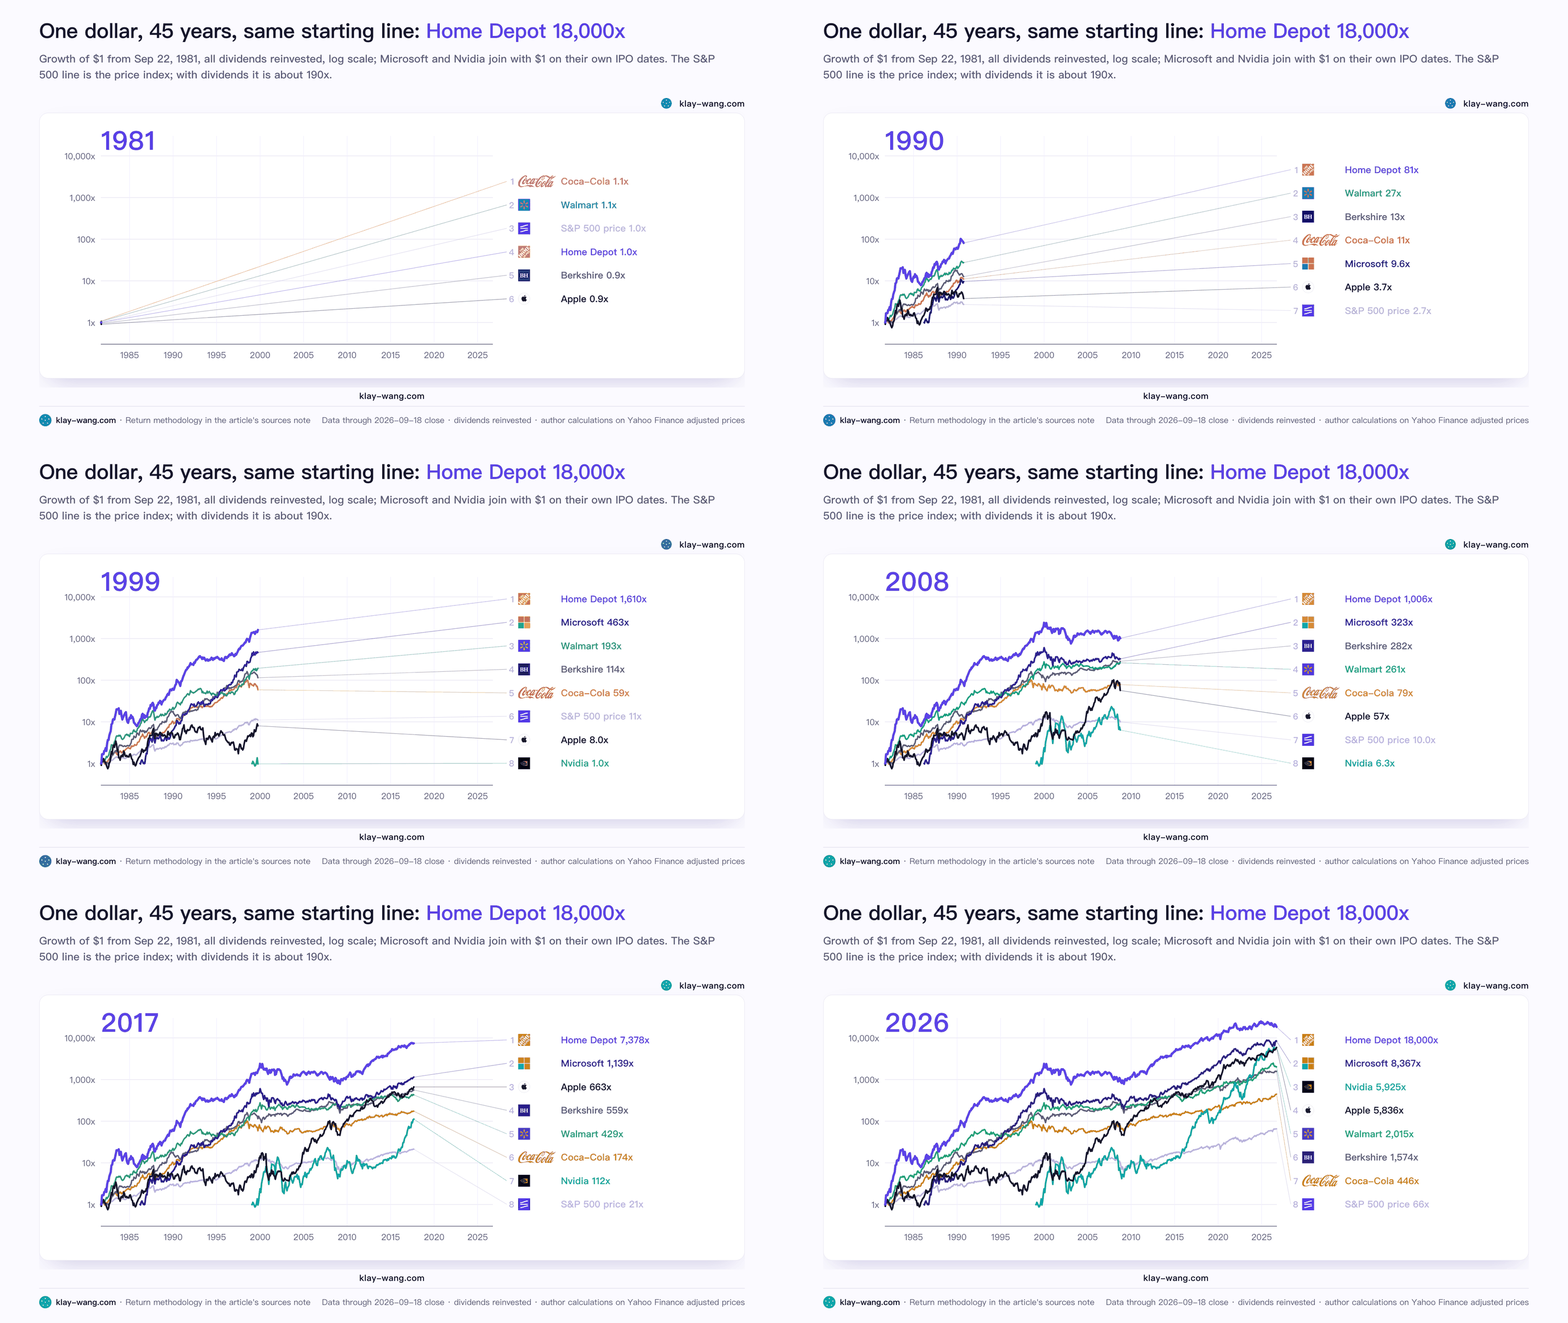
1981 年 9 月 22 日到 2026 年 9 月 18 日,家得宝股价涨了 1 万倍。加上股息再投资,1.6 万倍往上,从上市首日收盘算是 1.8 万倍。年化 24.4%。
同一个起点,苹果约 6000 倍,沃尔玛约 2000 倍,标普 500 指数 66 倍。
英伟达 1999 年上市,27 年涨了约 8900 倍,年化 37% 到 39%。跑得比家得宝快得多,但起跑晚了 18 年,累计倍数还是没追上。
这是 Acquired 播客两位主播 2026 年 9 月替《华尔街日报》算的账:从上市那天起算,美股没有任何一只股票的总回报超过家得宝。我自己用发行价 12 美元、13 次拆股后的 341 倍系数、加 Yahoo 的复权数据重算了一遍,1000 美元变 1560 万到 1830 万之间,看你从发行价还是首日收盘起算。1.6 万倍这个数,站得住。
一家卖钉子的。没有芯片,没有算法,没有网络效应,不烧钱,不讲故事。它怎么做到的?
01 两个被炒掉的中年人,和一辆二手凯迪拉克
1978 年春天,加州一家叫 Handy Dan 的家居连锁,把 CEO Bernie Marcus 和财务负责人 Arthur Blank 一起炒了。Marcus 那年 48 岁,Blank 35 岁。理由是内部斗争里常见的那种罪名,账上一笔钱用得不合规矩。
Marcus 是新泽西纽瓦克一个俄裔犹太木匠的儿子,学的是药剂,卖过化妆品,48 岁之前的人生跟五金没什么关系。
投资银行家 Ken Langone 听说以后跟 Marcus 说了一句话:你刚被一只金马蹄铁踢了屁股。意思是,你被解放了。
三个人凑了 200 万美元,1978 年 6 月注册公司。先去找的是 Ross Perot,那个后来选总统的德州富豪。Perot 愿意出 200 万拿 70% 的股份,谈到最后卡在一辆车上:Marcus 开一辆二手凯迪拉克,Perot 要求他公司所有人都开雪佛兰。Marcus 不肯换车,Perot 不肯投。Acquired 替他算过,这辆凯迪拉克让 Perot 错过了两千多亿美元。(历史上最贵的一辆二手车,没有之一)
1979 年 6 月 22 日,亚特兰大两家店同时开业,都是 JCPenney 旗下折扣店退租的旧仓库,一家在 Memorial Drive,一家在 Buford Highway。当时美国的五金店平均一万平方英尺、八千到一万种货,家得宝一上来就是六万平方英尺、两万五千种货以上,后来标准店型做到十万平方英尺、四五万种货。价格比全城任何一家都低。
开业那天没人来。Marcus 和 Blank 给自己的孩子发了 700 美元的一元钞票,让他们到停车场去,拉一个路人进店给一块钱。700 块发完了,店里还是空的。Marcus 后来回忆:我们就坐在那儿,一句话说不出来。
家得宝整个模式的根是一个数字:它的毛利率是 30%,同行是 45%。它砍掉了中间批发商,直接从厂家进货,把省下来的 15 个点全让给顾客。同行卖一块钱赚四毛五,它卖一块钱赚三毛,但它一家店的客流是隔壁 Lowe's 同等店的四倍。
店员是另一个根。它专门雇退休的水管工、电工、木匠穿橙色围裙站在货架前。你拿着一根坏掉的水管进去,有人告诉你怎么修,而且告诉你不用买贵的那个。
1981 年 9 月 22 日上市。四家店,发行价 12 美元,公司拿到手的钱只有四百万美元上下,整家公司估值不到四千万。那一年美国银行的优惠利率一度超过 20%,没有哪家大投行愿意碰它,最后是 Bear Stearns 做的。上市第一年股价涨了三倍多,华尔街还是没人看。
说白了,家得宝的起点是三件事:把毛利让给顾客,把专业留在店里,把批发商踢出去。45 年后你去看它的财报,这三件事一个字没改。
02 1985 年差点死掉,然后用十年涨了 35 倍
很多人以为家得宝是一条直线往上走。它 1985 年差点死了。
1984 年它花约四千万美元买了 Bowater 的九家店,在德州、路易斯安那和阿拉巴马。买回来发现货不对、人不对、口碑不对,员工几乎全换。同时新店越开越贵,一家店要 800 万美元。1985 年利润跌了 42%,长期债务两年从 400 万涨到 2 亿。股价跌到没人要。
Marcus 做的事很土:1986 年只开 10 家新店,全在已经站稳的城市;装了一套电脑库存系统;以每股 17 美元增发了 299 万股,把债还掉一截。
然后就是教科书上的那段。1986 年销售额过 10 亿,50 家店。1989 年超过 Lowe's,成为美国最大的家居建材零售商。要知道 Lowe's 1921 年就开了第一家店,1961 年就上市了,家得宝用十年把一个 68 岁的老大哥甩到身后。1995 年 350 家店,销售额 100 亿。
1990 年 1 月到 2000 年 1 月,家得宝股价涨了 35 倍,含股息 36 倍,年化 43%。1999 财年收入 384 亿美元,930 家店,每股盈利 1 美元。1999 年 12 月 31 日收盘 68.75 美元,公司市值 1280 亿。
你算一下,68.75 除以 1 块钱的盈利,市盈率 69 倍。用下一年的预期盈利算也有 50 倍。
一家卖钉子的,69 倍。那一年纳斯达克在 4000 点往 5000 点冲,所有人都在买科技股,家得宝被当成消费股里的科技股买。市场给它的计划是 2003 年开到 1900 家店,四年翻一倍,而且翻完之后还得继续高速开。
68.75 这个数,后面还要用。
03 最牛的股票,也有 13 年不涨
1999 年 12 月 31 日买入家得宝的人,要等到 2013 年 3 月 1 日,股价才第一次收在 68.75 之上。算上股息再投资,2012 年 8 月回本。中间 2009 年 3 月 6 日跌到 18 美元,从顶点跌了 74%。
2000 年 1 月到 2010 年 1 月这十年,家得宝含股息的总回报是负 48%,年化负 6.4%。
同一个十年,公司本身在干什么呢?2003 年开到 1707 家店,比市场要的 1900 家少,但收入 648 亿、利润 43 亿,跟当年的预期只差一成。到 2009 财年,收入 662 亿,店 2244 家,每股盈利从 1 美元涨到 1.57。
生意没坏,生意翻了一倍。股价腰斩再腰斩。
原因就一个:69 倍的市盈率,被压到了 11 倍。2003 年市值从 1280 亿掉到 860 亿,20 倍;2009 年 3 月那个 18 美元的底,除以 1.57 的盈利,11.5 倍。估值压缩吃掉了盈利增长的全部,还倒赔。
这中间还夹着一个 CEO。2000 年 12 月,家得宝从 GE 请来了 Bob Nardelli,他是杰克·韦尔奇接班人竞争的落选者。他把 GE 那套六西格玛、集中采购、数据考核全搬进来,把店里的全职老师傅换成更便宜的兼职,橙色围裙前面站着的水管工变成了扫码枪。2006 年 5 月 25 日的股东大会开在特拉华州威尔明顿,只开了 30 分钟,11 个董事只来了他一个,股东每人限问一个问题,台上摆一个数字钟,一分钟到,麦克风自动切断。
他在任六年零一个月,股价跌了 6.7%。2007 年 1 月 3 日离职,拿走 2.1 亿美元。
接任的 Frank Blake 做了几件跟 Nardelli 反着的事:把老师傅请回店里,裁了 1.1 万人,2009 年关掉 Expo 高端家居店,把开新店的速度踩死。2007 年 1 月到 2014 年 11 月,他在任期间总回报 191%。
有两组数字,我觉得比 1.6 万倍本身更值得记。
第一组。从 1999 年 12 月 31 日那个顶点算到今天,家得宝含股息 7.7 倍,年化 7.9%。同一段时间,XLP,也就是一篮子沃尔玛、好市多、可口可乐、宝洁、菲利普莫里斯的必需消费品 ETF,6.8 倍,年化 7.4%。美股 45 年回报第一的股票,你要是买在顶上,26 年下来跟一篮子牙膏可乐赚得几乎一样多。而且它这六年的月度走势跟 XLP 的相关性从 0.37 升到了 0.61,市场已经把它当一只必需消费股在交易。
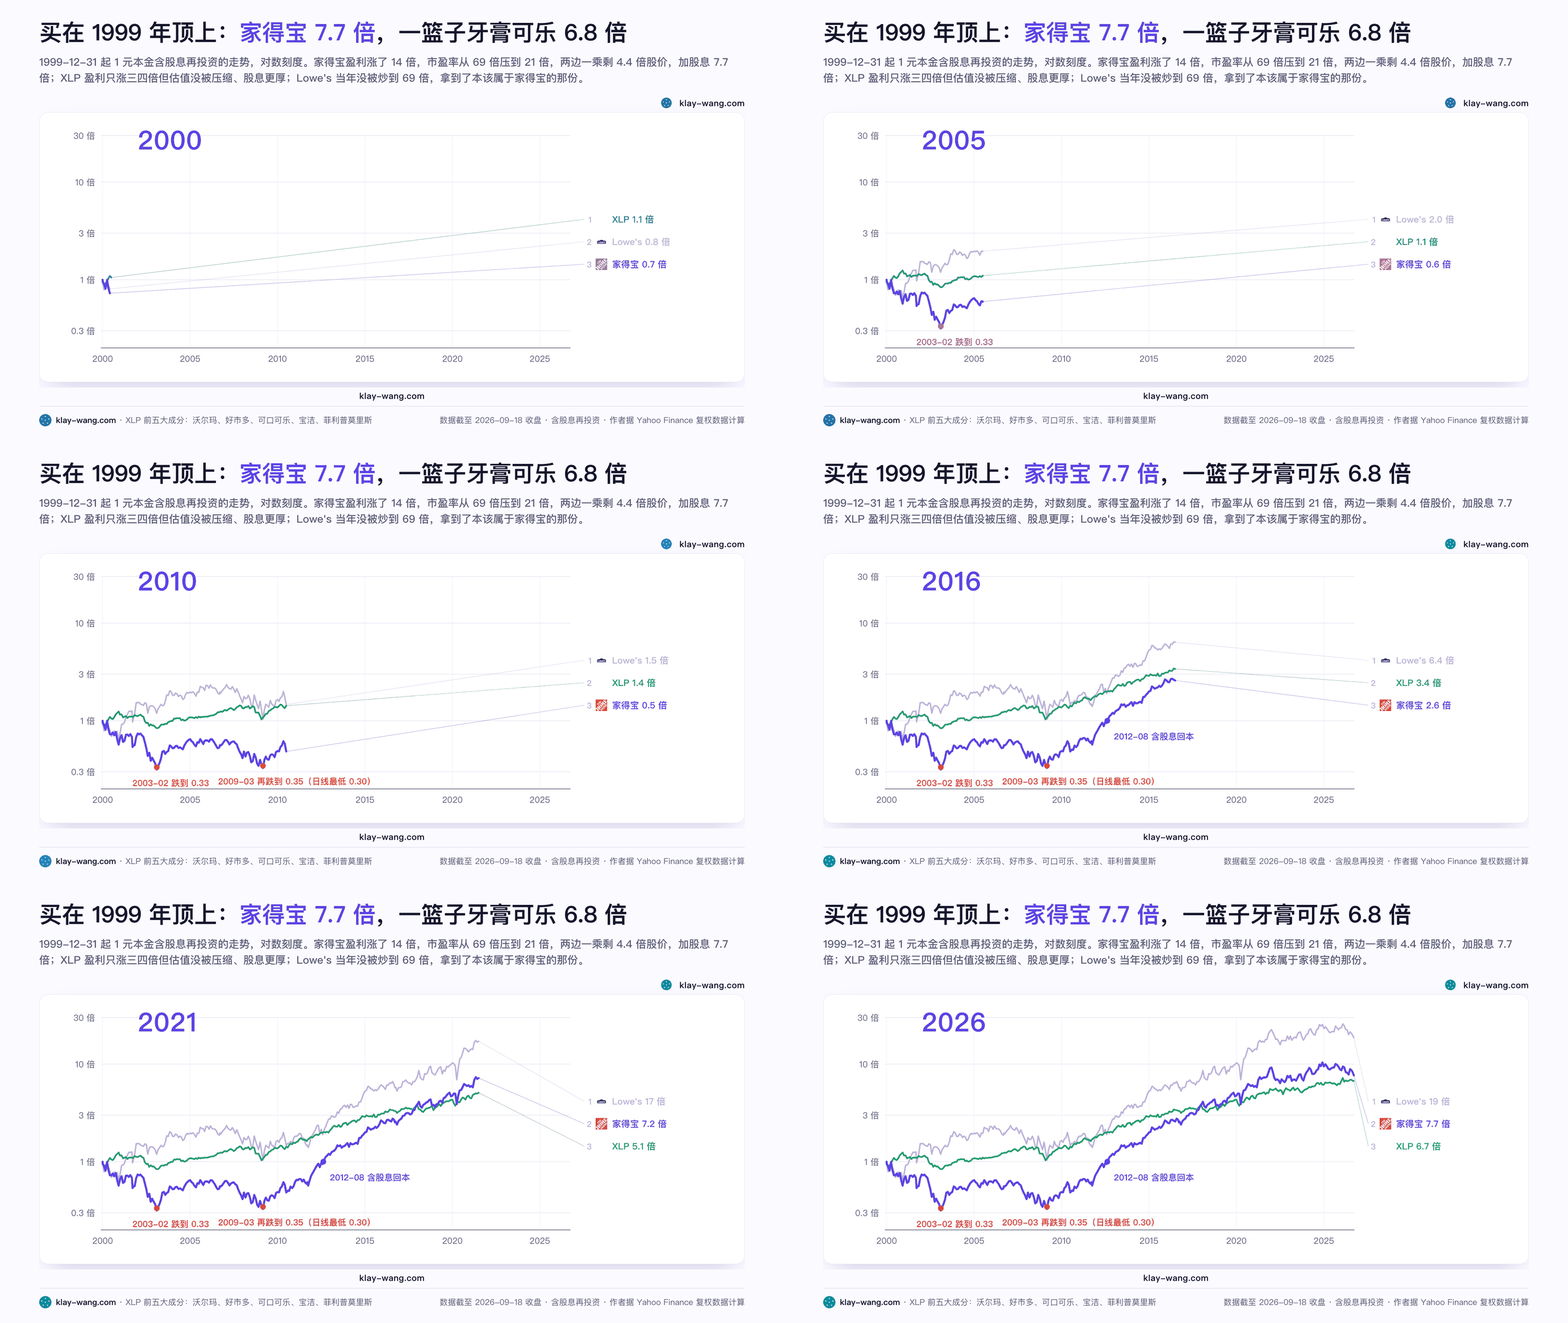
第二组。同一个起点,1999 年底,二哥 Lowe's 到今天是 18.7 倍,老大家得宝 7.7 倍,二哥是老大的 2.4 倍。而从 1981 年家得宝上市那天起算,家得宝是 Lowe's 的 32 倍。起点一换,老大老二对调。2003 年《福布斯》回头看那十年,Lowe's 年化 30%,家得宝 10%,原因不复杂,Lowe's 一直比家得宝便宜,而且它正在把小店改成大店,处在家得宝十年前的位置上。
我把这段写这么细,是因为它回答了一个大多数人不愿意面对的问题:最好的公司,买贵了也是 13 年零回报。1999 年那批人买的公司没有错,错的是 69 倍。
坦白讲,这两组数比 1.6 万倍有用得多。1.6 万倍是给没上车的人看的,13 年是给上了车的人看的。
04 17 年不开新店,收入翻了 2.3 倍
家得宝有一个数字我第一次看到的时候以为看错了。
2008 财年末,它有 2274 家店。2025 财年末,2359 家。17 年,净增 85 家,一年开 5 家。
同一个 17 年,收入从 713 亿涨到 1647 亿,2.3 倍。每平方英尺销售额从 2009 财年的 273 美元涨到 2024 财年的 600 美元。
翻译成大白话:店还是那些店,货架还是那些货架,每一块地板上卖出去的东西翻了一倍多。今天它有 47 万员工,标准店 10.4 万平方英尺的室内加 2.4 万平方英尺的园艺区,2026 财年的计划也只开 15 家新店。
钱从哪来?两个地方。
一个是 Pro,也就是装修工、屋顶工、水电工这些拿它当进货渠道的专业客户。2025 财年 1647 亿收入里,Pro 贡献了约 900 亿,超过一半。2024 年它花 182.5 亿美元买下 SRS Distribution,一家给屋顶、景观和泳池承包商供货的分销商,是家得宝历史上最大的一笔收购;2025 年 9 月又通过 SRS 花约 55 亿买了做石膏板和钢架的 GMS。
还有一个很少人注意的来回。2006 年 Nardelli 花 32 亿买了 Hughes Supply,改名 HD Supply,想做批发;2007 年 Blake 上任半年就把它卖了,谈好的 103 亿因为房市崩盘砍到 85 亿;2020 年 12 月,家得宝又花 80 亿把 HD Supply 买了回来。卖出去 85 亿,买回来 80 亿,中间隔了 13 年,还是同一家公司。它 45 年前把批发商踢出去,现在自己一层一层往批发上爬,因为 DIY 那半边已经长到头了。
另一个是美国的房子本身。
美国自住房的中位数房龄,2024 年是 42 年。2005 年这个数是 31 年。47% 的自住房已经超过 45 岁。美国 65% 的家庭住自己的房子,全部住宅里 54% 是自住的独栋。2024 年二手房成交 406 万套,是 1995 年以来最低的一年,因为大家 2021 年锁定了 3% 的房贷利率,谁也不肯搬。不搬家就得修,2026 年美国人花在自住房维修改造上的钱,哈佛住房研究中心估约 5200 亿美元。
一栋 42 岁的木头房子,是一台需要不停换零件的机器。屋顶二三十年一换,热水器十年上下一换,外墙油漆几年一刷。房子越老,家得宝越好。而美国的房子只会越来越老,因为新房建得少,卖得也少。
这是家得宝跟英伟达最大的区别。英伟达的需求要靠下一代芯片去创造,家得宝的需求是上一代房子留下来的。一个是往前跑,一个是往后收。
05 一半的钱,来自最无聊的部分
把 1.8 万倍拆开,它的构成跟你想象的不一样。
都从上市首日收盘起算:只看股价,45 年是 1 万倍;算上股息再投资,1.8 万倍。中间差的那 8000 多倍,是股息。最终财富里有 45% 来自你每个季度收到、然后买回去的那几毛钱。
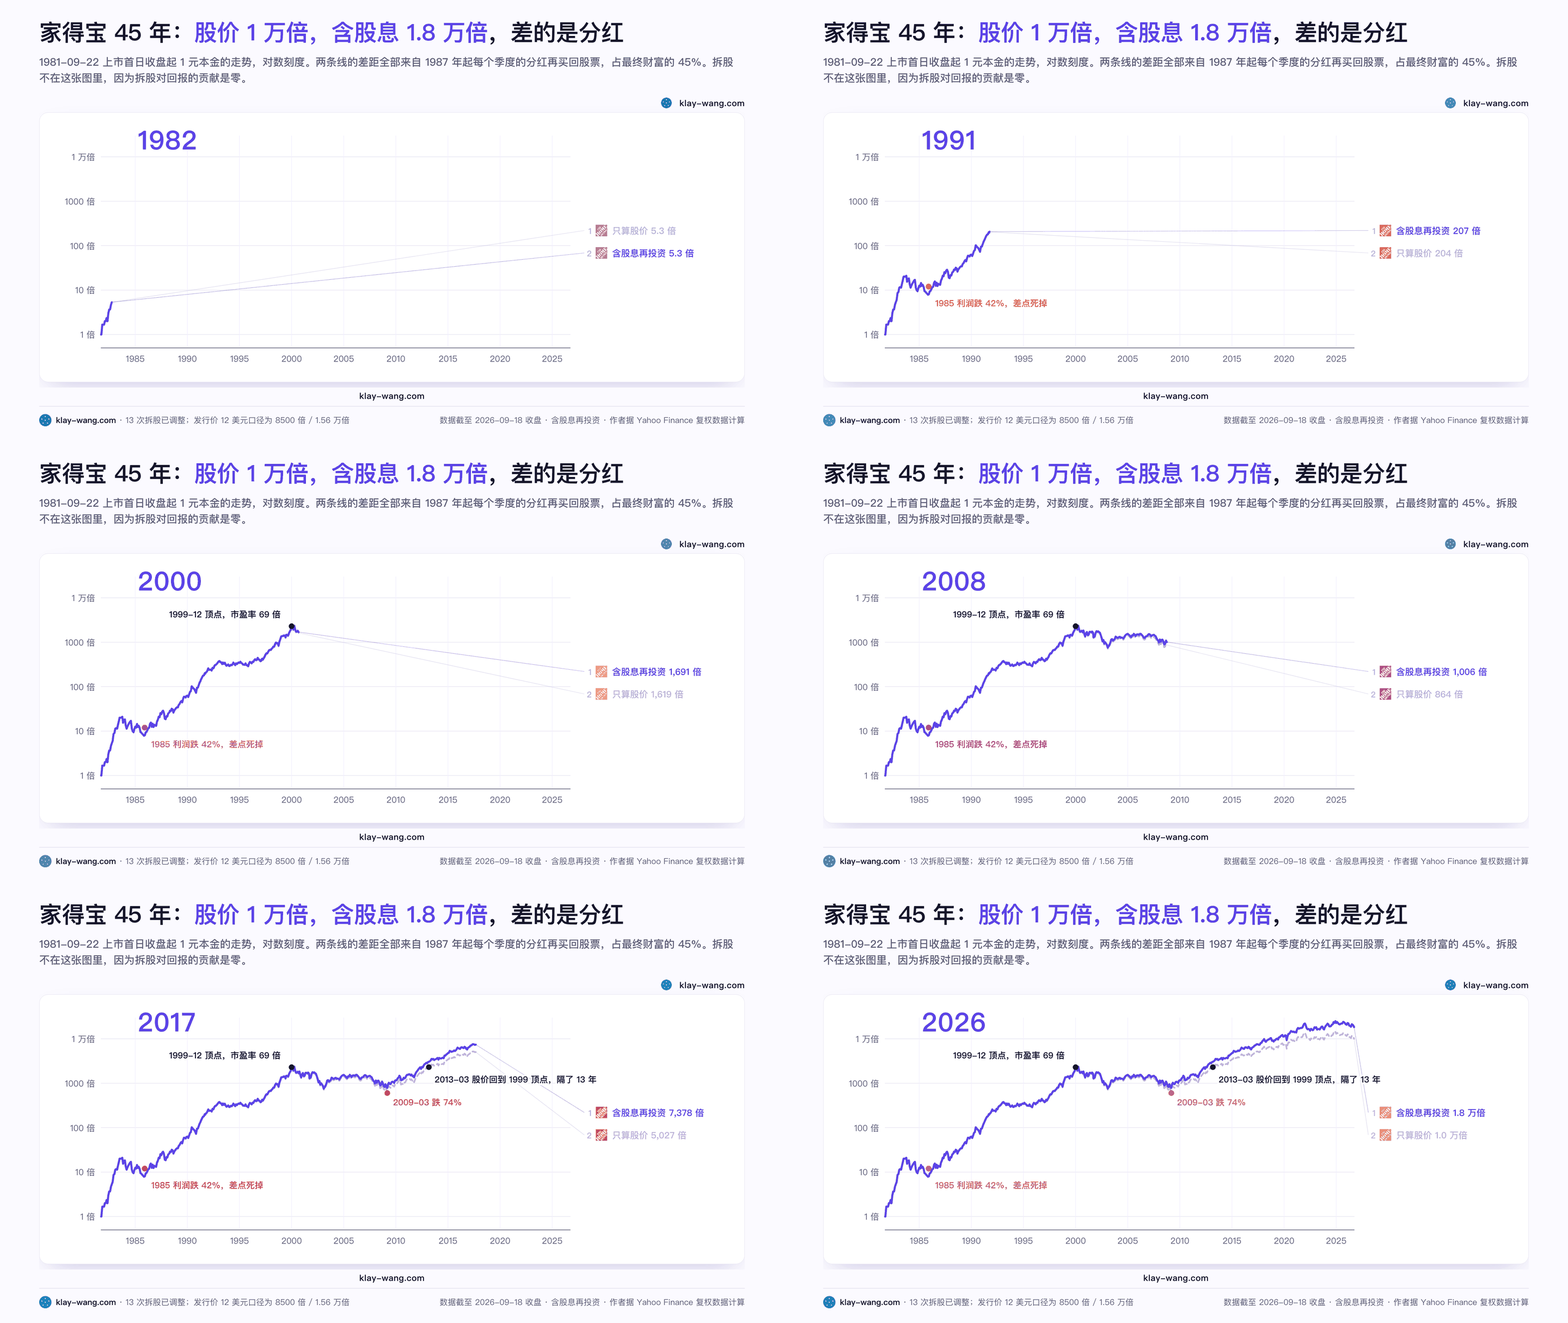
家得宝 1987 年开始分红,之后没有断过一个季度。2024 财年一年分了 89 亿美元,每股 9 美元。
再看股本。2003 年它有 23.6 亿股,2026 年不到 10 亿股。2002 年到 2017 财年累计回购 751 亿美元,之后到 2024 年 3 月为收购 SRS 暂停之前,每年还在买几十亿到一百五十亿,累计超过一千亿美元。
这个动作的威力在每股盈利上。2009 财年到 2024 财年,净利润从 27 亿涨到 148 亿,5.5 倍;每股盈利从 1.57 涨到 14.91,9.5 倍。多出来的那 4 倍,全是分母缩小做的功。
一家不需要开新店的公司,赚来的钱只有两个去处:分给你,或者把别人的股份买回来送给你。家得宝两件都做到了极致。
上面这些没有一句是性感的,但它是 45 年账本里最重的一页。一个季度一个季度地分红,一年一年地回购,17 年不开新店。所谓的复利,很多时候就是这种无聊的重复。
一定有人会拿两家公司来挑战:可乐和伯克希尔。一个是靠分红出名的,一个是从不分红也从不拆股的。正好拿它们把三件常被混在一起的事拆开。
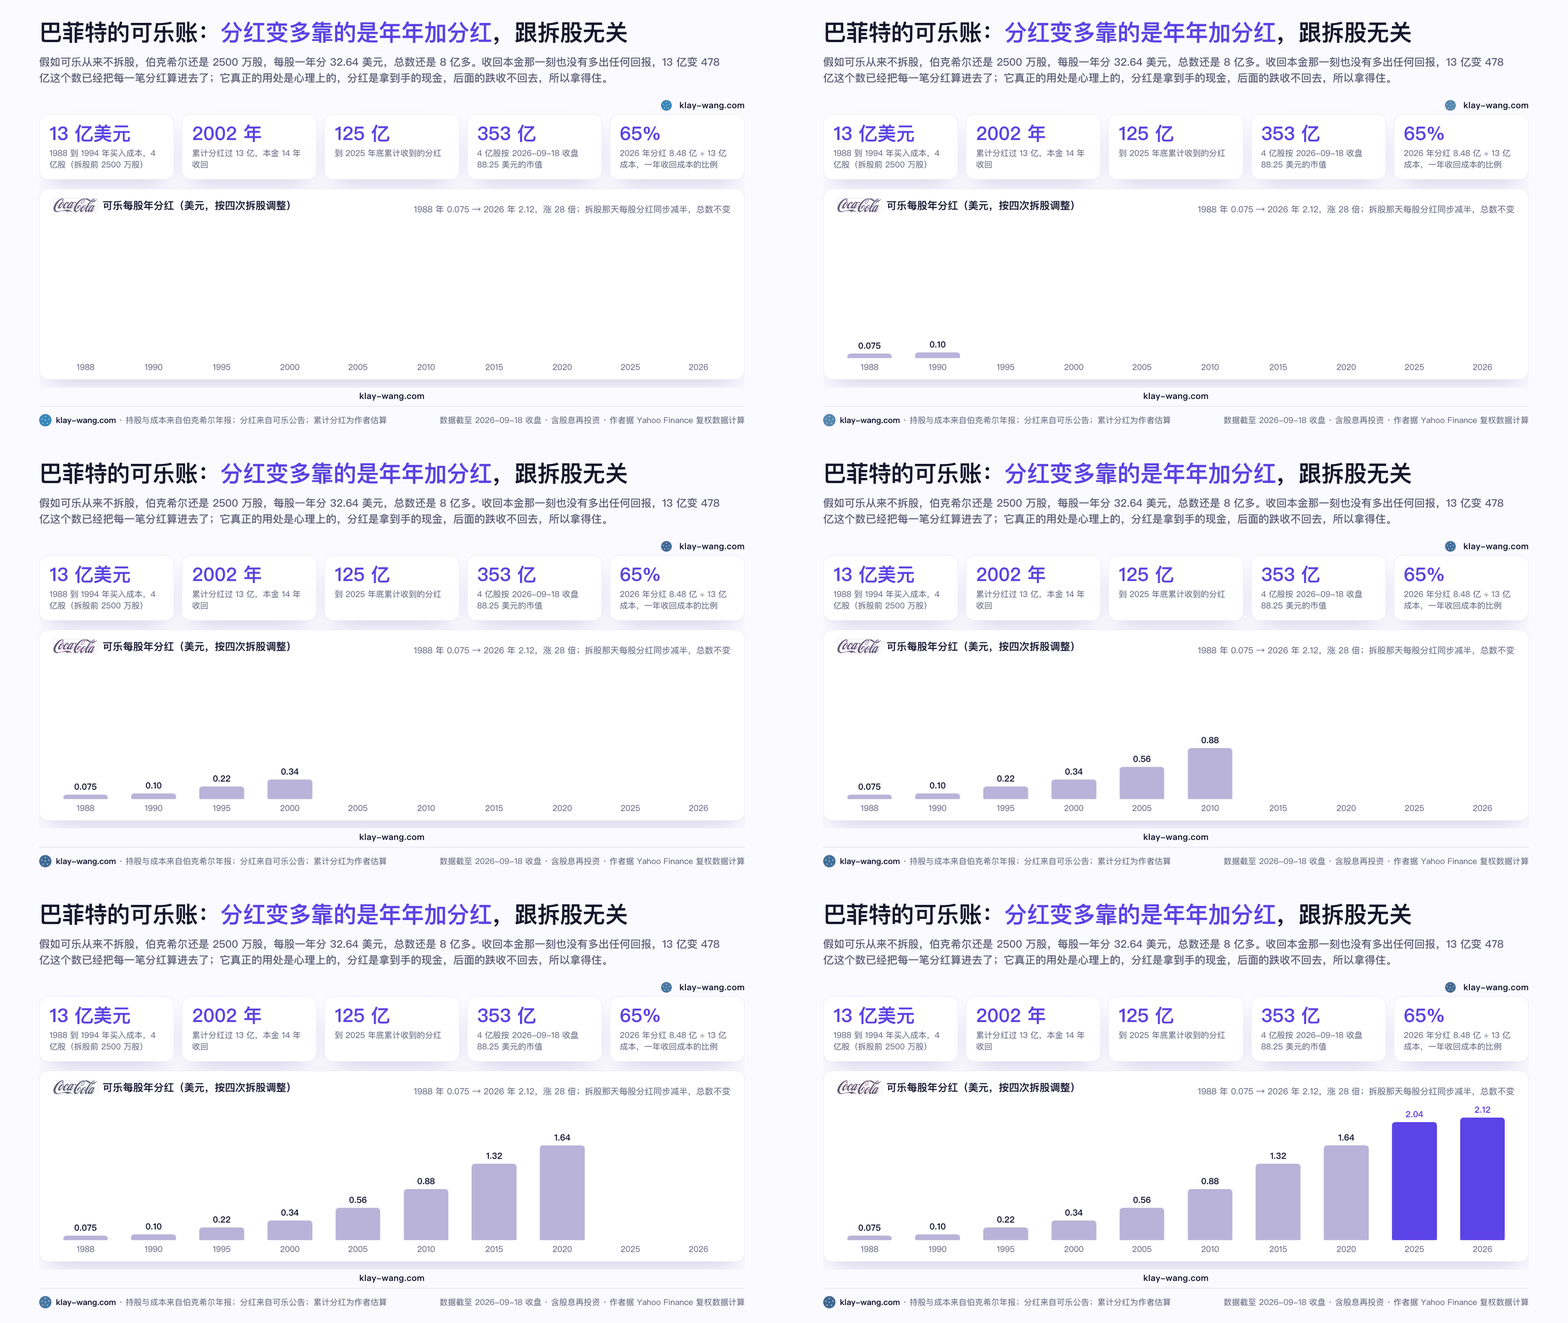
第一件,拆股不产生回报。家得宝 13 次拆股把 1 股变成 341 股,每次拆完股价同比例往下走,你手里的市值一分没变。可乐也一样,1990、1992、1996、2012 年四次一拆二,巴菲特 13 亿美元买的可乐从 2500 万股变成 4 亿股,每股分红也跟着除以 16。假如可乐从来不拆股,他还是 2500 万股,每股一年分 32.64 美元,总数还是 8 亿多。伯克希尔 A 股 60 年一次没拆,一股 76 万美元,照样 6 万倍。
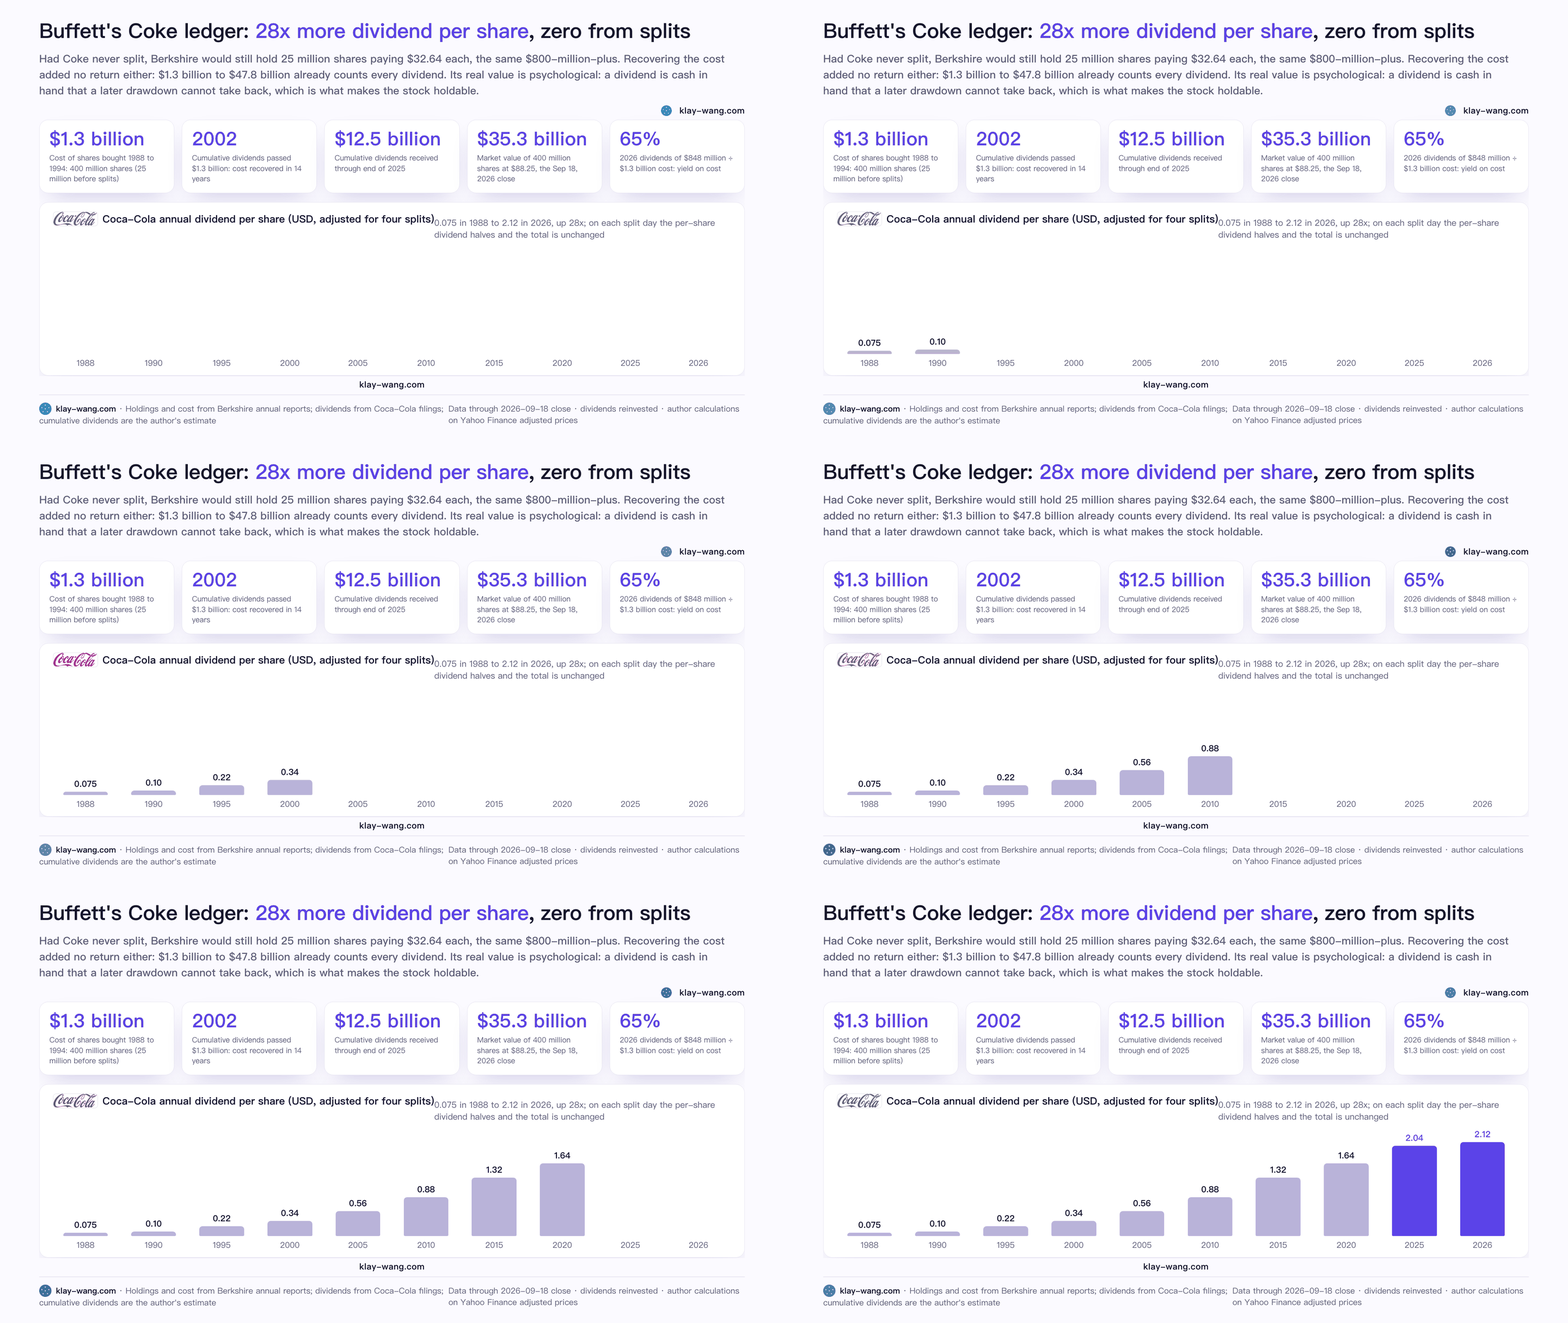
第二件,让分红变多的是公司每年提高每股分红,跟拆股无关。可乐按拆股调整后的口径,1988 年每股一年分 7.5 美分,2025 年 2.04 美元,2026 年 2 月第 64 次上调到 2.12,涨了 28 倍。巴菲特那 13 亿成本没变,每年收到的分红从 1989 年的三千多万涨到 2025 年的 8.16 亿,2026 年会到 8.48 亿,这就是他那笔投资一年收回成本 65% 的来源。
第三件,收回本金不等于多赚。我按可乐历年分红算了一下,伯克希尔 1988 年起买的那批可乐,累计分红大约在 2002 年过了 13 亿,也就是 14 年左右本金收回,到 2025 年底累计分了约 125 亿,手里 4 亿股按 2026 年 9 月 18 日收盘值 353 亿。13 亿变 478 亿,37 年,年化 10% 出头。这个数已经把每一笔分红算进去了,收回本金那一刻没有多出一分钱,只是你给已经算过的钱换了个标签。它真正的用处是心理上的:分红是拿到手的现金,后面的下跌收不回去,所以拿得住。1999 年买在家得宝顶上的人,股价 2013 年才回本,算上分红 2012 年 8 月就回本了,早了半年多。
这三件事放回家得宝的账上:1.6 万倍里 45% 是分红再投资,跟 13 次拆股一点关系没有,跟 1987 年起每个季度都涨的那笔分红有关系。
06 中国人不知道的:它在中国输得一塌糊涂
2006 年 12 月,家得宝花一亿多美元买下天津的家世界家居,12 家店,正式进中国,之后在北京、天津、西安、郑州、沈阳、青岛开店。六年换了三任中国区总裁。2012 年 9 月 14 日,它宣布关掉最后 7 家,全部撤出,税后计提 1.45 亿美元,中国媒体算的总亏损约 1.6 亿。
关店那天出了事。员工占了四家店过周末,安装工把三个高管扣了 80 个小时,供应商抓了一个脚受伤的运营经理。
当时的 CFO Carol Tomé 后来讲过内幕。她说的第一条是:中国人不住带车库的房子,没地方放工具,他们想的是雇个人来做。
第二条是店里的人:一家店 100 个家得宝员工,旁边站着 200 个厂家派来的促销员,各卖各的。第三条是房子:中国的店全是租的,低价租约到期一续,房租翻倍。第四条最离谱:中国厂家不肯在中国卖货给它,它只能把货运到美国,再从美国运回中国。
不只是家得宝。英国的百安居 2014 年 12 月把中国业务 70% 的股权卖给了物美,39 家店,作价 1.4 亿英镑。卖的理由跟家得宝一模一样:在中国,修房子不是休闲活动,因为人工便宜,总有人替你干。
为什么同一门生意在中国做不成?三件事:
1: 房子不一样。美国是 42 年房龄的独栋木头房子,中国是 2000 年以后建的钢筋混凝土公寓,而且新房越来越多按精装交付,住建部 2024 年的征求意见稿甚至提出新建城镇住宅应当全装修交付。前者是一台需要你自己保养的机器,后者是一个物业管的盒子,交到你手上的时候连地板都铺好了。
2: 人工不一样。美国叫一个水管工上门,光上门费 50 到 150 美元,修一单 180 到 500 美元,自己动手是省钱;中国叫一个师傅,上门费几十块,自己动手是浪费时间。DIY 这个词在中国是兴趣,在美国是经济学。
3: 链条不一样。中国的家装钱走的是装修公司和建材市场,红星美凯龙、居然之家这类卖场是收租的房东模式,货是厂家的,人是厂家的,卖场只管场地。家得宝那套自己进货、自己雇人、自己定价的重模式,在这条链上找不到位置。
有意思的地方在这里:让家得宝在中国失败的东西,正是让它在美国成为回报第一的东西。老房子、贵人工、没有中间商。它没有做错什么,它只是一个只能长在一种土壤里的物种。
07 回报排行榜,是一个口径游戏
45 年回报第一这句话,对一半,错一半。
对的一半:从家得宝上市那天起算,到今天,含股息,确实没有一只美股超过它。
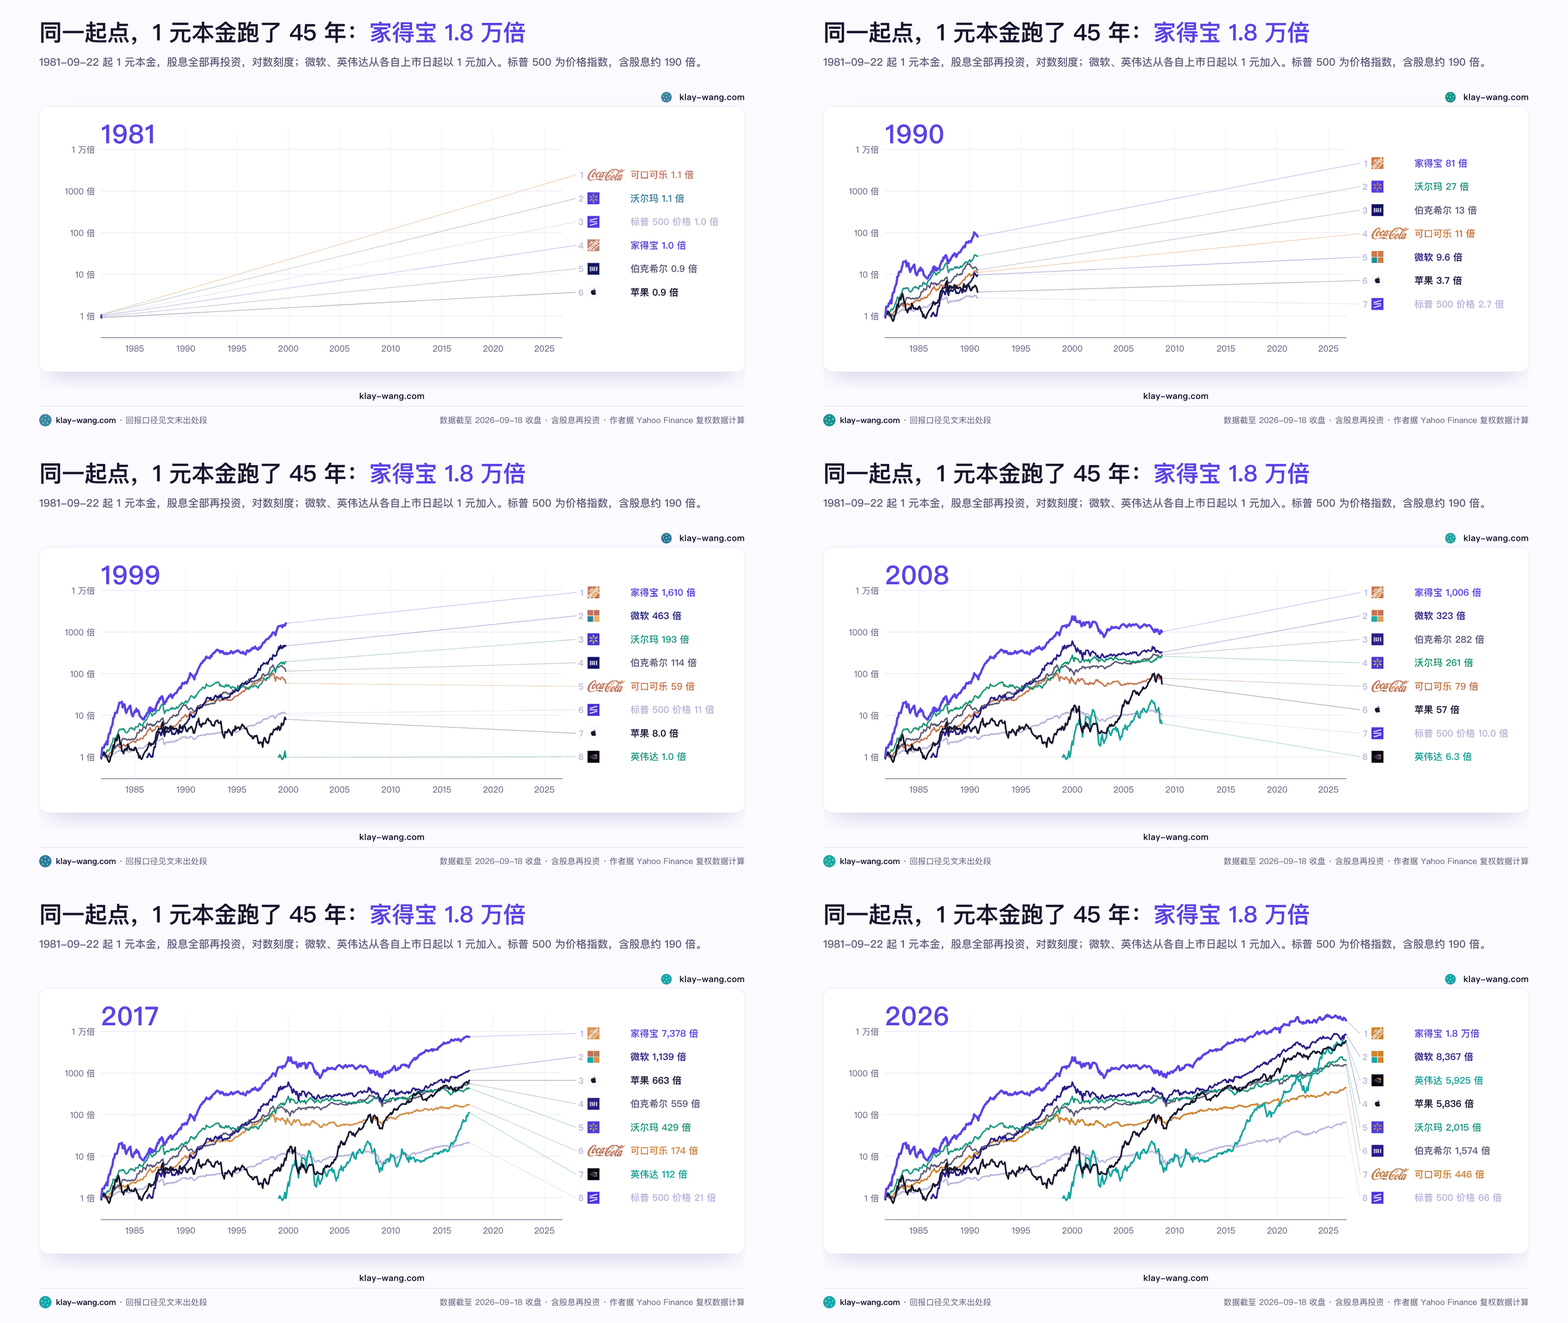
错的一半在于起点。看下面这张表,全部按 2026 年 9 月 18 日收盘。
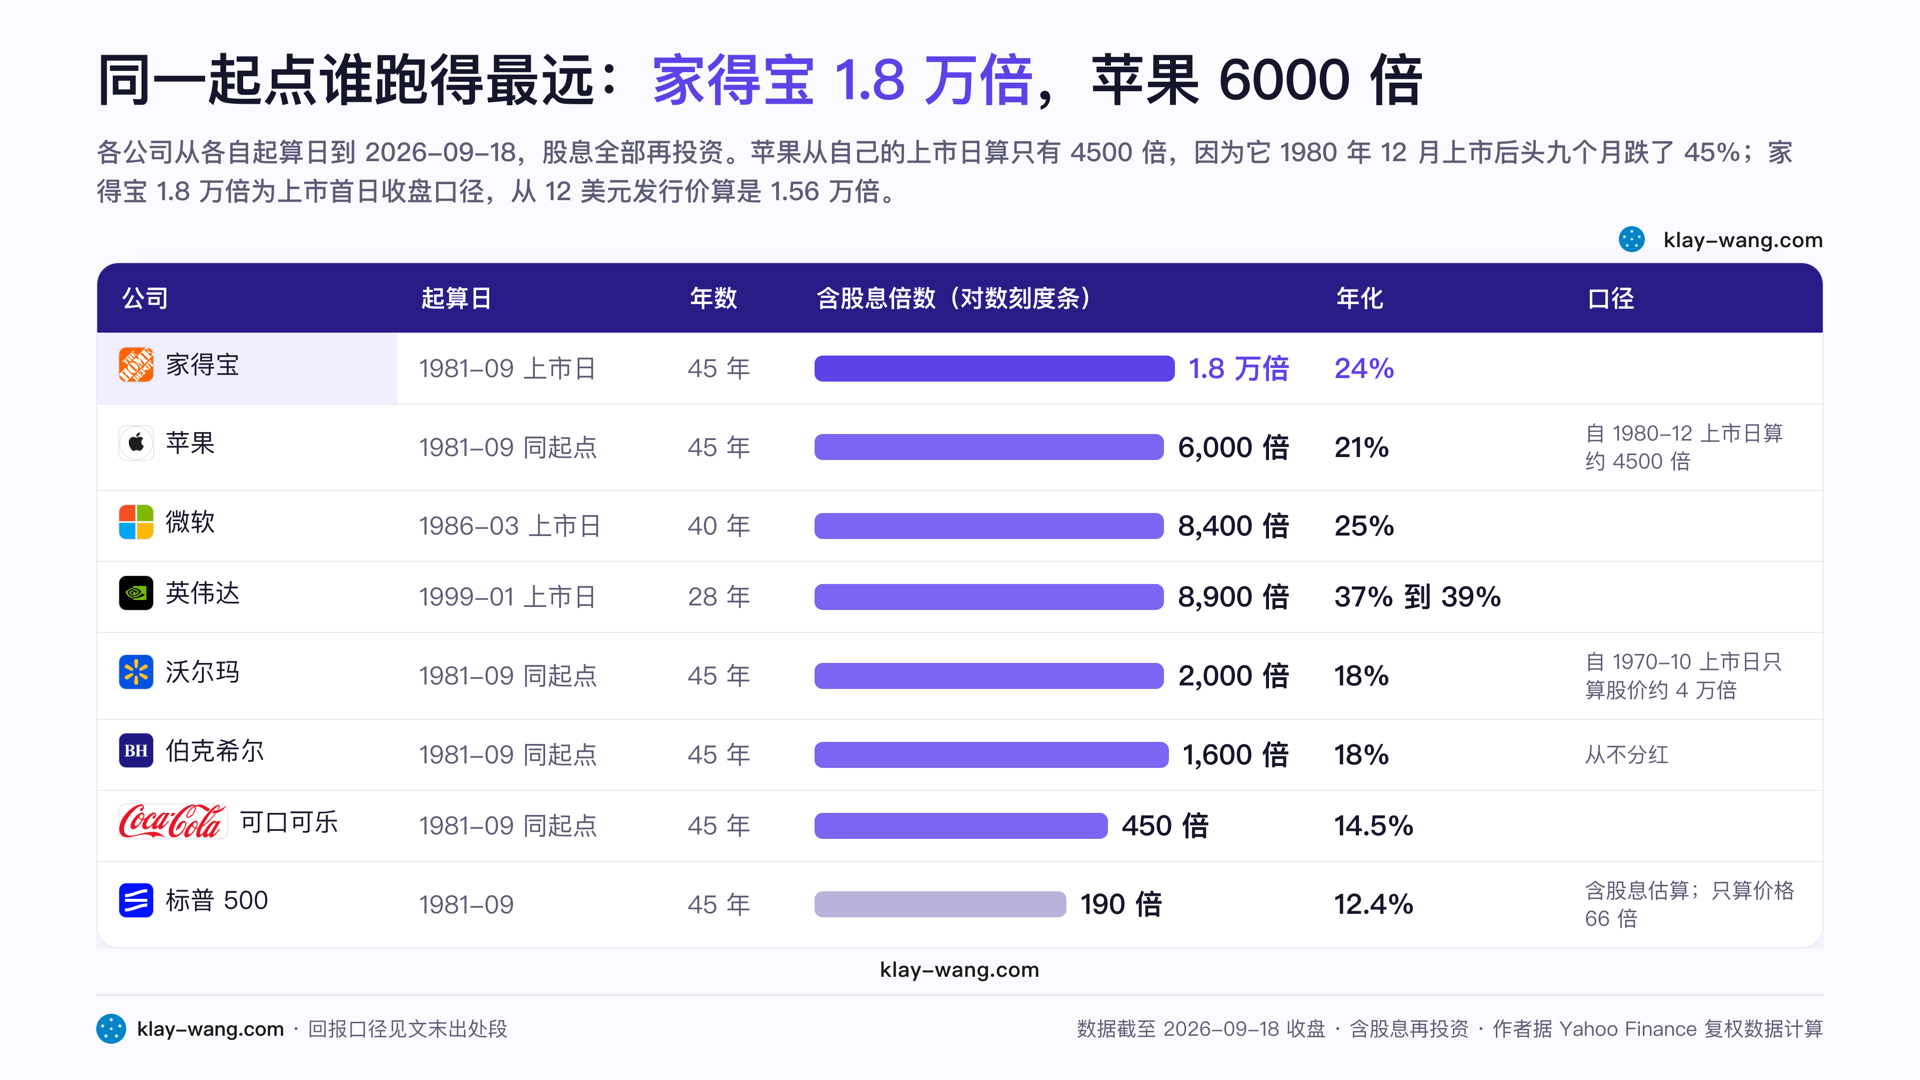
三件事:
第一件,苹果的起点被挑过。苹果 1980 年 12 月上市,到 1981 年 9 月家得宝上市那天已经跌了 45%。各从各的上市日算,家得宝是苹果的 4 倍;从同一天算,只有 3 倍。Acquired 用的是前者。
第二件,沃尔玛更早。它 1970 年上市,从它自己的上市日算,只看股价就是约 4 万倍,含股息还要往上翻。所以史上从上市日起算回报第一这个头衔,其实属于沃尔玛。家得宝拿的是 1981 年 9 月 22 日之后这个组别的第一。
第三件,标普那一行要看含股息的数。我表里 66 倍是价格指数,把每年的股息再买回去,1981 年 9 月到今天大约 190 倍,年化 12.4%。拿家得宝比指数,应该拿 18305 比 190,不是比 66。顺便一提,同一个起点,巴菲特的伯克希尔约 1600 倍,可口可乐约 450 倍,都在家得宝后面很远。
第四件,年化才是投资水平。英伟达 37% 到 39%,家得宝 24%,苹果 20%。家得宝的累计倍数靠的是多跑了 18 年,一年 24% 跑 45 年,比一年 39% 跑 27 年多。你要是问哪个更难,是英伟达。你要是问哪个更能被普通人拿住,是家得宝,因为它 45 年里最大的回撤是 74%,英伟达 2002 年跌过近 90%,2008 年跌过 85%,2022 年又跌 66%。
还有一个背景数字,亚利桑那州立大学的 Bessembinder 教授数过:1926 年到 2022 年,美股 28100 只股票里,58.6% 的股票让股东亏钱,55.1 万亿美元的净财富里有 50 万亿以上由前 2% 的公司创造。家得宝在他的历史财富创造榜上排进前二十。这个榜最新一版的前十里,八个是科技公司,另外两个是埃克森和沃尔玛。卖油的,卖日用品的,卖钉子的。
反方:这家公司现在还值得看吗
先把反方说满。
2020 年 1 月到 2026 年 9 月,家得宝含股息年化只有 7.4%,跟 XLP 一样,跑输标普一半。股价 300 美元,比 2024 年的 368 跌了近两成,市盈率 21 倍。2025 财年利润 142 亿,比上一年少了 6 亿,四个季度里三个没达到预期。2026 年 2 月 25 日的财报电话会上,CEO Ted Decker 的原话是:房市停摆了,我们的客户在告诉我们,他们不会投钱做大项目。2025 年 12 月的投资者日给 2026 年的指引是同店销售持平到 2%,每股盈利持平到涨 4%。房贷利率到了三年低点,二手房成交还是没起来。2026 年 8 月 18 日的二季报好了一点,同店涨 1.7%,是 2022 年以来最好的一个季度,但全年指引一个字没动。
更根本的问题:它跟 AI 一点关系都没有。这个时代的钱在往算力上走,一家 45 年只做一件事的公司,凭什么再拿 24%?
回到判断。
它拿不到 24% 了,这一点我同意。1981 年到 2000 年那种 43% 的年化,是从四家店开到一千家店的红利,这段结束了。2010 年到 2020 年的 25%,是估值从 11 倍修回 20 倍加上回购,这段也结束了。往后它是一家成熟公司,跟着美国房子的老化速度走,好年份高个位数,差年份原地踏步。
结论收窄到一句话:家得宝的故事,用处在当一份对照组,跟你今天买不买它没关系。
对照什么?对照你手里那些讲故事的公司。当你觉得一家公司必须有 AI、必须有平台、必须有网络效应才值得拿 20 年的时候,这里有一家卖钉子的,靠让利、靠老师傅、靠不开新店、靠分红回购,做出了美股 45 年最高的累计回报。
它证明的东西很简单:钱可以从最无聊的地方长出来,前提是你别在 69 倍的时候买。
三句话
1: 家得宝 45 年 1.6 万倍,靠的是让利、老师傅和不开新店,跟技术没有一毛钱关系。
2: 就算是它,1999 年买贵了也要等 13 年,26 年下来跟一篮子牙膏可乐赚得一样多,好公司和好股票中间隔着一个市盈率。
3: 它在中国开 12 家店就撤了,输给它的东西,正是它在美国赢的东西。
私货
写完这篇,我想起自己 2020 年写红杉那篇里的一句话:历史的机遇更重要,人都太渺小了。
家得宝是那句话的另一个版本。它吃到的是美国 1980 年代以后郊区独栋住宅的扩张,再吃到 2010 年以后这批房子集体变老。两代人的房子,一家公司从头修到尾。Marcus 和 Blank 当然厉害,但把他们俩空降到 2006 年的天津,六年一样亏完。
还是那句话,选择 Beta 的能力其实是一种 Alpha。
另外一件事。我今年每天写美股,越来越不信颠覆这个词。真正让钱变多的公司,多数在做一件千年不变的事:人要住房子,房子会坏,坏了要修。你把这句话换成人要吃饭、人要喝水、人要付钱,就是麦当劳、可口可乐、Visa。技术每十年换一次,这些需求一次没换过。
我现在挑公司,会先问一个笨问题:它卖的东西,我爷爷用不用?家得宝,用。英伟达,不用。这不代表英伟达不好,只代表两种钱的性质不一样:一种要你猜对未来,一种只要你等得起。
我是等得起的那种人。(当然,前提是别在 69 倍的时候进场。这句话我写下来了,以后回头对账用)
出处与口径说明:股价与总回报按 2026 年 9 月 18 日收盘(家得宝 299.98 美元、苹果 336.13、微软 493.78、英伟达 222.27、沃尔玛 106.73),用 Yahoo Finance 复权数据计算,含股息再投资;家得宝从 12 美元发行价与 341 倍拆股系数起算为 1 万 5600 倍,从上市首日收盘起算为 1 万 8300 倍,《华尔街日报》转述 Acquired 播客的 1000 美元变 1600 万对应前一口径;苹果从其 1980 年 12 月 22 美元发行价起算含股息约 4500 倍,从 1981 年 9 月 22 日起算约 6000 倍,两者相差来自苹果上市后头九个月的下跌;沃尔玛 1970 年 10 月发行价 16.5 美元,拆股系数 6144,只算股价约 4 万倍,股息未计入;英伟达从 1999 年 1 月 12 美元发行价、拆股系数 480 起算约 8900 倍,从首日收盘起算约 5900 倍;伯克希尔与可口可乐同起点倍数用 Yahoo 复权数据(伯克希尔 A 股无股息,倍数即股价倍数);标普 500 表中 66 倍为价格指数,含股息约 190 倍是按伯克希尔 2025 年股东信附表里标普逐年含股息收益率连乘 1982 到 2025 年、再补 1981 年末三个月与 2026 年至 9 月 18 日的涨幅估算,年化 12.4% 同法;可乐部分:巴菲特持股 4 亿股、成本 12.99 亿美元来自伯克希尔年报,四次拆股日期来自可乐公司股本历史,每股分红 1988 年 0.075 美元、2025 年 2.04 美元、2026 年 2.12 美元按拆股调整口径取自 Yahoo 与公司公告,8.16 亿与 8.48 亿为股数乘每股分红,累计分红约 125 亿与 2002 年收回成本为作者按拆股调整后逐年分红乘持股数估算(1988 到 1993 年持股按 3.736 亿股当量、1994 年起 4 亿股),353 亿为 4 亿股乘 2026 年 9 月 18 日收盘 88.25 美元;伯克希尔 60 年约 6 万倍与一股 76 万美元来自 2025 年股东信与 2026 年 9 月 18 日收盘;XLP 与 Lowe's 的对比同样用复权数据,起点 1999 年 12 月 31 日;相关性为月度收益的相关系数,1999 年起 333 个月、2020 年起 81 个月。1981 年 IPO 募资额各源不一,Acquired 与《华尔街日报》口径为 400 万美元上下、估值不到 4000 万,Motley Fool 口径为 60 万股共 720 万美元,本文取前者并保留分歧;首店货品数各源有两万五千到四万五千之说,本文两个数都写了。1985 年危机、1986 年增发、1989 年超越 Lowe's 数据来自 Funding Universe 公司史;Bowater 收购价一源 3840 万一源 4000 万,本文写约四千万。1999 年市值 1280 亿、2003 年 1707 家店与 860 亿市值来自 Speedwell Research 的回顾备忘,69 倍为 1999 年 12 月 31 日收盘价除以 1999 财年已实现的每股盈利,50 倍为该备忘的前瞻口径。Nardelli 任期股价按 2000 年 12 月 5 日至 2007 年 1 月 3 日收盘计算,2006 年股东大会细节来自 CNN Money 与 CFO.com 当时报道;Blake 任期按 2007 年 1 月 3 日至 2014 年 11 月 3 日。HD Supply 三次交易分别来自家得宝 2006、2007 年公告与 2020 年 12 月收购公告。收入、门店、每股盈利、股息、回购、员工数来自家得宝各财年 10-K 与业绩公告,2002 至 2017 财年累计回购 751 亿美元为 10-K 原文,之后的累计数为逐年相加的估算。Pro 占比约一半为公司口径与 PYMNTS 报道,SRS 182.5 亿为收购对价,GMS 约 55 亿含债务。Decker 引语来自 2026 年 2 月 25 日财报电话会的《财富》杂志报道,2026 年指引来自 2025 年 12 月 9 日投资者日公告。房龄中位数 42 年与 47% 来自 NAHB 对 2024 年美国社区调查的整理,65% 自有住房率来自美国人口普查局,54% 自住独栋占比来自 NAHB 对 2023 年数据的整理;二手房成交 406 万套来自全美房地产经纪人协会;5200 亿维修改造支出为哈佛住房研究中心 LIRA 对 2026 年的预测值;水管工价格为 HomeAdvisor 2025 年口径。中国部分来自家得宝 2012 财年 10-Q、Carol Tomé 2013 年在亚特兰大的公开讲述(Saporta Report)、腾讯财经与央视网 2012 年 9 月报道;百安居交易来自 Kingfisher 2014 年 12 月公告;全装修政策来自住建部 2024 年 2 月《住宅项目规范(征求意见稿)》。Bessembinder 数据来自其 2023 年论文 Shareholder Wealth Enhancement 1926 to 2022。文中所有倍数均为历史回报,不构成任何投资建议。
First published on klay-wang.com, September 21, 2026
In brief. On September 22, 1981, an Atlanta hardware warehouse with four stores listed over the counter at $12 a share. Nobody on Wall Street wanted it. Forty-five years later, $1,000 put in that day, with dividends reinvested, is $16 million. The same money in Apple over the same stretch is $4 million. The company is Home Depot. It sells nails, lumber, toilets and paint. It opened 12 stores in China, lost money for six years, and pulled out completely in 2012; on the way out, three of its executives were held for 80 hours. Why does a business that cannot work in China become the best-performing US stock of 45 years? I went through the whole 45-year ledger. The answer is not the one you expect.
About 6,500 words. Give it at least 15 minutes, and read it twice.
Some numbers first.
From September 22, 1981 to September 18, 2026, Home Depot's share price rose 10,000-fold. With dividends reinvested, more than 16,000-fold, and 18,000-fold if you count from the first day's close. That is 24.4% a year.
From the same starting line, Apple is about 6,000x, Walmart about 2,000x, the S&P 500 index 66x.
Nvidia listed in 1999 and has risen about 8,900x in 27 years, 37% to 39% a year. Much faster than Home Depot, but it started 18 years later, and the cumulative multiple still has not caught up.
This is the math the two hosts of the Acquired podcast did for the Wall Street Journal in September 2026: counted from listing day, no US stock has a higher total return than Home Depot. I redid it myself with the $12 offer price, the 341x split factor from 13 splits, and Yahoo's adjusted data: $1,000 becomes somewhere between $15.6 million and $18.3 million, depending on whether you start from the offer price or the first close. The 16,000x figure holds.
A company that sells nails. No chips, no algorithms, no network effects, no cash burn, no story. How?
01 Two fired middle-aged men and a used Cadillac
In the spring of 1978, a California home-improvement chain called Handy Dan fired its CEO, Bernie Marcus, and its finance chief, Arthur Blank, together. Marcus was 48 that year, Blank 35. The charge was the usual kind from an internal fight: a sum on the books spent outside the rules.
Marcus was the son of a Russian Jewish cabinetmaker in Newark, New Jersey. He trained as a pharmacist and sold cosmetics. Nothing in his first 48 years had much to do with hardware.
When investment banker Ken Langone heard, he told Marcus: you just got kicked in the ass by a golden horseshoe. Meaning: you have been set free.
The three of them scraped together $2 million and registered the company in June 1978. The first person they went to was Ross Perot, the Texas billionaire who later ran for president. Perot was willing to put in $2 million for 70% of the company. The talks broke down over a car: Marcus drove a used Cadillac, and Perot required everyone at his companies to drive Chevrolets. Marcus would not change cars, Perot would not invest. Acquired ran the numbers: that Cadillac cost Perot more than $200 billion. The most expensive used car in history, nothing else comes close.
On June 22, 1979, two stores opened in Atlanta on the same day, both old warehouses vacated by JCPenney's discount arm, one on Memorial Drive, one on Buford Highway. The average American hardware store at the time was 10,000 square feet with 8,000 to 10,000 items. Home Depot opened at 60,000 square feet and more than 25,000 items; the standard format later reached 100,000 square feet and 40,000 to 50,000 items. Prices lower than anyone else in town.
Nobody came on opening day. Marcus and Blank handed their kids $700 in one-dollar bills and sent them to the parking lot to pull passers-by into the store for a dollar each. The $700 ran out and the store was still empty. Marcus recalled later: we just sat there, unable to say a word.
There is one number here that is the root of the whole Home Depot model: its gross margin was 30%, against 45% for the industry. It cut out the wholesalers, bought straight from manufacturers, and gave all 15 points of savings to the customer. A competitor earned 45 cents on a dollar of sales, Home Depot earned 30, but one of its stores drew four times the traffic of a comparable Lowe's next door.
The staff were the other root. It deliberately hired retired plumbers, electricians and carpenters and stood them in orange aprons in front of the shelves. You walk in with a broken pipe, someone tells you how to fix it, and tells you that you do not need the expensive one.
It listed on September 22, 1981. Four stores, $12 a share, roughly $4 million raised for the company, the whole business valued at under $40 million. The US prime rate had touched more than 20% that year, no big investment bank would touch the deal, and Bear Stearns ended up running it. The stock more than tripled in its first year and Wall Street still was not looking.
Put plainly, Home Depot started with three things: give the margin to the customer, keep the expertise in the store, kick out the wholesaler. Read its filings 45 years later and not a word of that has changed.
02 Nearly dead in 1985, then 35x in ten years
Most people picture Home Depot as a straight line up. It nearly died in 1985.
In 1984 it paid about $40 million for nine Bowater stores in Texas, Louisiana and Alabama. The merchandise was wrong, the people were wrong, the reputation was wrong, and nearly the whole staff had to be replaced. Meanwhile new stores were getting more expensive, $8 million each. In 1985 profit fell 42%, and long-term debt went from $4 million to $200 million in two years. The stock fell to where nobody wanted it.
What Marcus did was unglamorous: only 10 new stores in 1986, all in cities where it already stood firm; a computerized inventory system; a secondary offering of 2.99 million shares at $17 to pay down a chunk of the debt.
Then came the textbook stretch. Sales passed $1 billion in 1986, with 50 stores. In 1989 it passed Lowe's to become the largest home-improvement retailer in America. Lowe's had opened its first store in 1921 and listed in 1961; Home Depot took ten years to leave a 68-year-old elder brother behind. By 1995, 350 stores and $10 billion in sales.
From January 1990 to January 2000 the stock rose 35x, 36x with dividends, 43% a year. Fiscal 1999 revenue was $38.4 billion, 930 stores, earnings of $1 a share. It closed 1999 at $68.75 on December 31, a market value of $128 billion.
Do the division: $68.75 over $1 of earnings is a P/E of 69. On the next year's expected earnings it was still 50.
A company that sells nails, at 69 times. That was the year the Nasdaq was charging from 4,000 toward 5,000, everyone was buying tech, and Home Depot was being bought as the tech stock among consumer names. The market's plan for it was 1,900 stores by 2003, doubling in four years, and then to keep opening at speed after that.
Remember $68.75. The next section is entirely its bill.
03 Even the best stock can go 13 years without rising
Anyone who bought Home Depot on December 31, 1999 had to wait until March 1, 2013 for the first close above $68.75. With dividends reinvested, they got back to even in August 2012. Along the way, on March 6, 2009, the stock hit $18, down 74% from the top.
For the ten years from January 2000 to January 2010, Home Depot's total return with dividends was minus 48%, minus 6.4% a year.
What was the company itself doing in those ten years? By 2003 it had 1,707 stores, fewer than the 1,900 the market wanted, but revenue of $64.8 billion and profit of $4.3 billion, only a tenth short of the old expectations. By fiscal 2009, revenue was $66.2 billion, 2,244 stores, and earnings per share had gone from $1 to $1.57.
The business did not break. The business doubled. The stock halved and then halved again.
One reason: a P/E of 69 was compressed to 11. In 2003 the market value went from $128 billion to $86 billion, 20 times earnings; the $18 bottom in March 2009 over $1.57 of earnings is 11.5 times. Multiple compression ate all of the earnings growth and then some.
There was a CEO in the middle of this. In December 2000, Home Depot brought in Bob Nardelli from GE, the loser in the race to succeed Jack Welch. He moved the whole GE kit in: Six Sigma, centralized purchasing, metrics for everything. He replaced full-time veterans in the stores with cheaper part-timers, and the plumber in the orange apron became a barcode scanner. The 2006 annual meeting on May 25 was held in Wilmington, Delaware, lasted 30 minutes, and he was the only one of 11 directors to show up. Each shareholder was limited to one question, a digital clock sat on the stage, and when the minute was up the microphone cut off.
In six years and one month in the job, the stock fell 6.7%. He left on January 3, 2007 with $210 million.
His successor Frank Blake did several things the opposite way: he brought the veterans back into the stores, cut 11,000 jobs, closed the upscale Expo stores in 2009, and slammed the brakes on new openings. From January 2007 to November 2014, total return during his tenure was 191%.
Now two sets of numbers that I think are worth remembering more than the 16,000x itself.
First set. From that December 31, 1999 top to today, Home Depot is 7.7x with dividends, 7.9% a year. Over the same stretch, XLP, the consumer-staples ETF that is a basket of Walmart, Costco, Coca-Cola, P&G and Philip Morris, is 6.8x, 7.4% a year. Buy the best-returning US stock of 45 years at the top, and 26 years later you have made almost exactly what a basket of toothpaste and cola made. And over the last six years, the correlation of its monthly moves with XLP has risen from 0.37 to 0.61. The market already trades it as a staples stock.
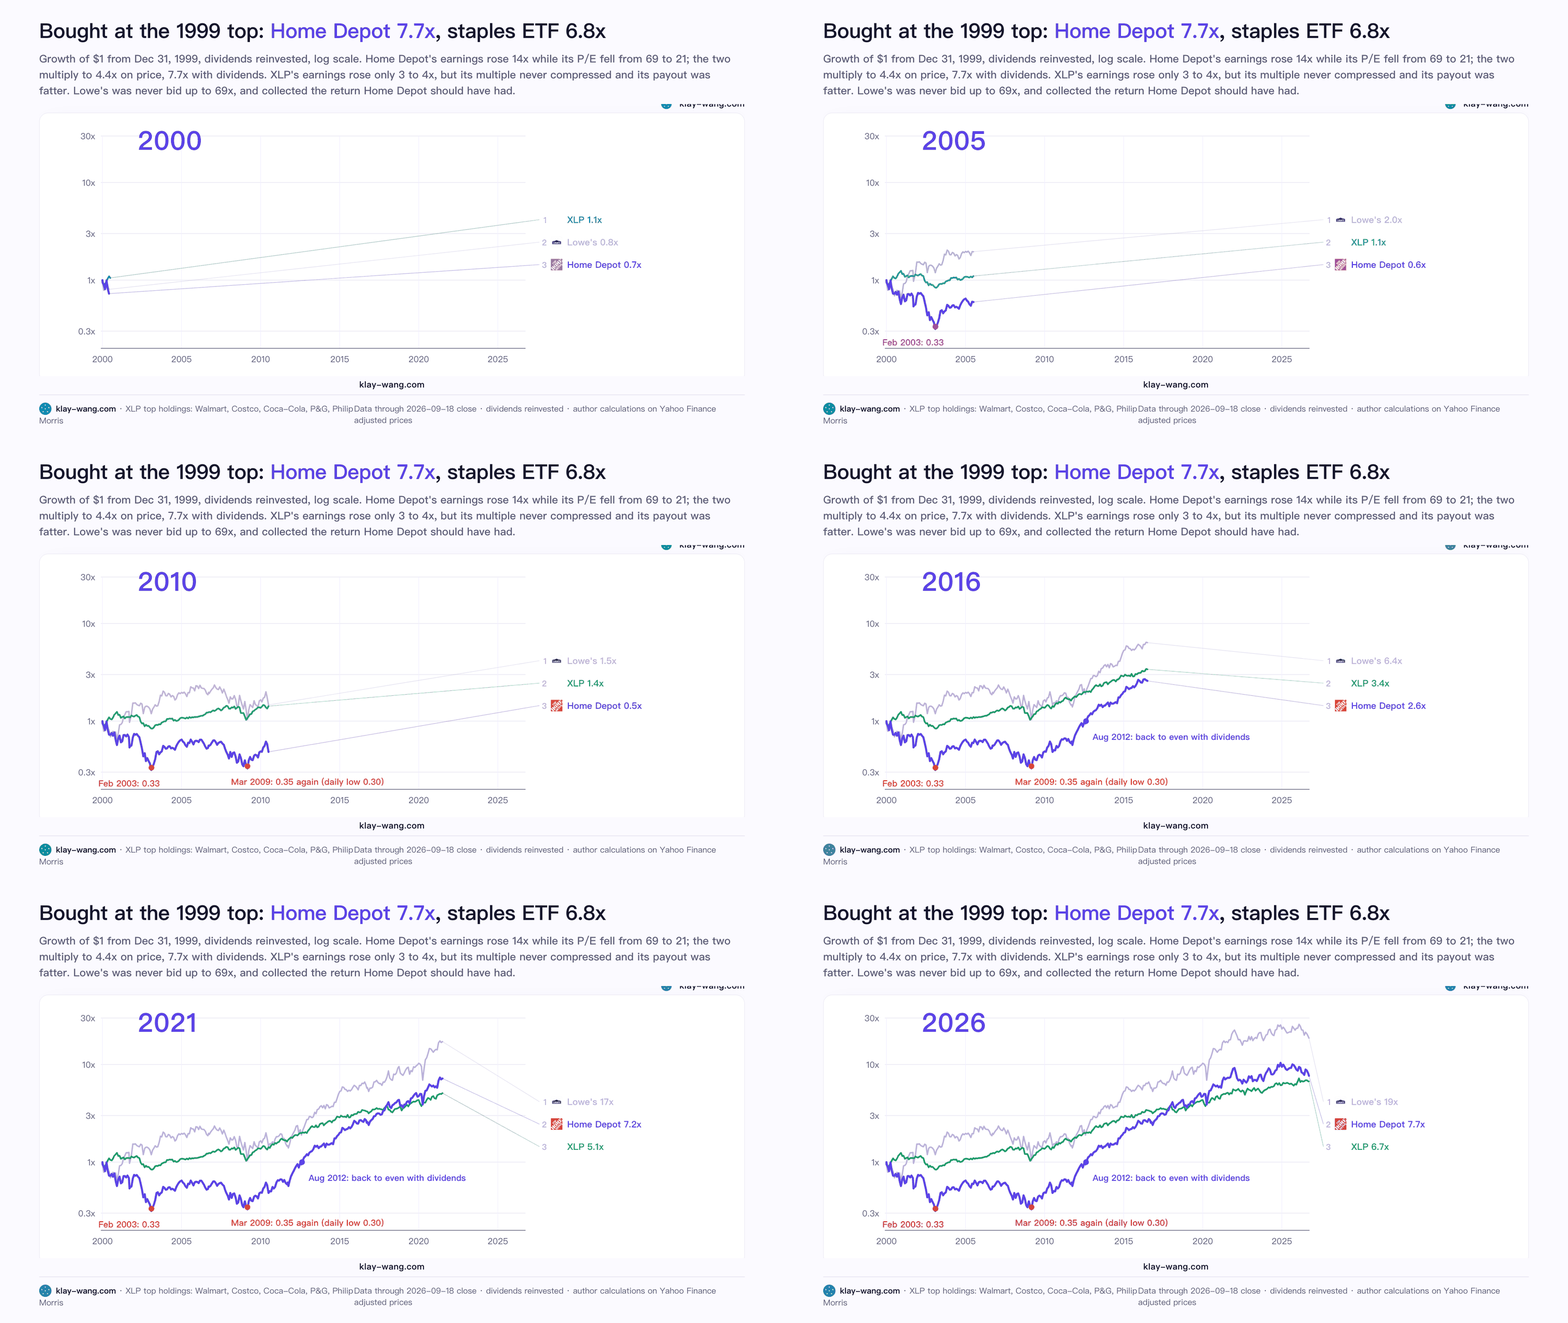
Second set. From the same start, the end of 1999, the number two, Lowe's, is 18.7x today, and the number one, Home Depot, is 7.7x. Number two is 2.4 times number one. But counted from Home Depot's listing day in 1981, Home Depot is 32 times Lowe's. Move the starting line and the two swap places. Looking back over that decade in 2003, Forbes had Lowe's at 30% a year and Home Depot at 10%. The reason is not complicated: Lowe's was always cheaper than Home Depot, and it was converting small stores into big ones, standing where Home Depot had stood ten years earlier.
I wrote this stretch in such detail because it answers a question most people would rather not face: buy the best company too dear and you still get 13 years of nothing. The people who bought in 1999 did not pick the wrong company. They paid 69 times.
Frankly, this section is far more useful than the 16,000x. The 16,000x is for people who never got on. The 13 years is for people who did.
04 Seventeen years without new stores, revenue up 2.3x
There is one Home Depot number I thought I had misread the first time I saw it.
At the end of fiscal 2008 it had 2,274 stores. At the end of fiscal 2025, 2,359. Seventeen years, a net 85 stores, five a year.
Over the same 17 years, revenue went from $71.3 billion to $164.7 billion, 2.3x. Sales per square foot went from $273 in fiscal 2009 to $600 in fiscal 2024.
In plain words: same stores, same shelves, and every square foot of floor sells more than twice what it did. Today it has 470,000 employees, a standard store of 104,000 square feet indoors plus a 24,000-square-foot garden center, and the plan for fiscal 2026 is only 15 new stores.
Where does the money come from? Two places.
One is Pro: the remodelers, roofers, plumbers and electricians who use it as their supply line. Of the $164.7 billion of fiscal 2025 revenue, Pro brought in about $90 billion, more than half. In 2024 it paid $18.25 billion for SRS Distribution, a distributor to roofing, landscaping and pool contractors, the largest acquisition in its history; in September 2025 it bought GMS, which does drywall and steel framing, through SRS for about $5.5 billion.
There is a round trip here that few people notice. In 2006 Nardelli paid $3.2 billion for Hughes Supply, renamed it HD Supply, and tried to do wholesale; in 2007, six months into his tenure, Blake sold it, the agreed $10.3 billion cut to $8.5 billion by the housing crash; in December 2020, Home Depot bought HD Supply back for $8 billion. Sold for $8.5 billion, bought back for $8 billion, 13 years apart, same company. Forty-five years ago it kicked the wholesalers out; now it is climbing into wholesale one layer at a time, because the DIY half has grown as far as it can.
The other place is the American house itself.
The median age of an owner-occupied home in the US was 42 years in 2024. In 2005 it was 31. Forty-seven percent of owner-occupied homes are already over 45. Sixty-five percent of American households own their home, and 54% of all housing units are owner-occupied single-family houses. Existing-home sales in 2024 were 4.06 million, the lowest since 1995, because everyone locked in a 3% mortgage in 2021 and nobody will move. If you do not move, you repair. Harvard's Joint Center for Housing Studies puts American spending on repairs and improvements to owner-occupied homes at about $520 billion in 2026.
A 42-year-old wooden house is a machine that needs parts replaced without end. A roof every 20 or 30 years, a water heater every 10 or so, exterior paint every few years. The older the house, the better for Home Depot. And American houses will only get older, because few new ones are built and few are sold.
That is the biggest difference between Home Depot and Nvidia. Nvidia's demand has to be created by the next generation of chips. Home Depot's demand was left behind by the last generation of houses. One runs forward, the other collects from behind.
05 Half the money came from the most boring part
Back to the multiple. Take it apart and its composition is not what you imagine.
Both counted from the first day's close: price alone, 10,000x over 45 years; with dividends reinvested, 18,000x. The 8,000-odd x in between is dividends. Forty-five percent of the final wealth came from the few dimes you received every quarter and bought back in.
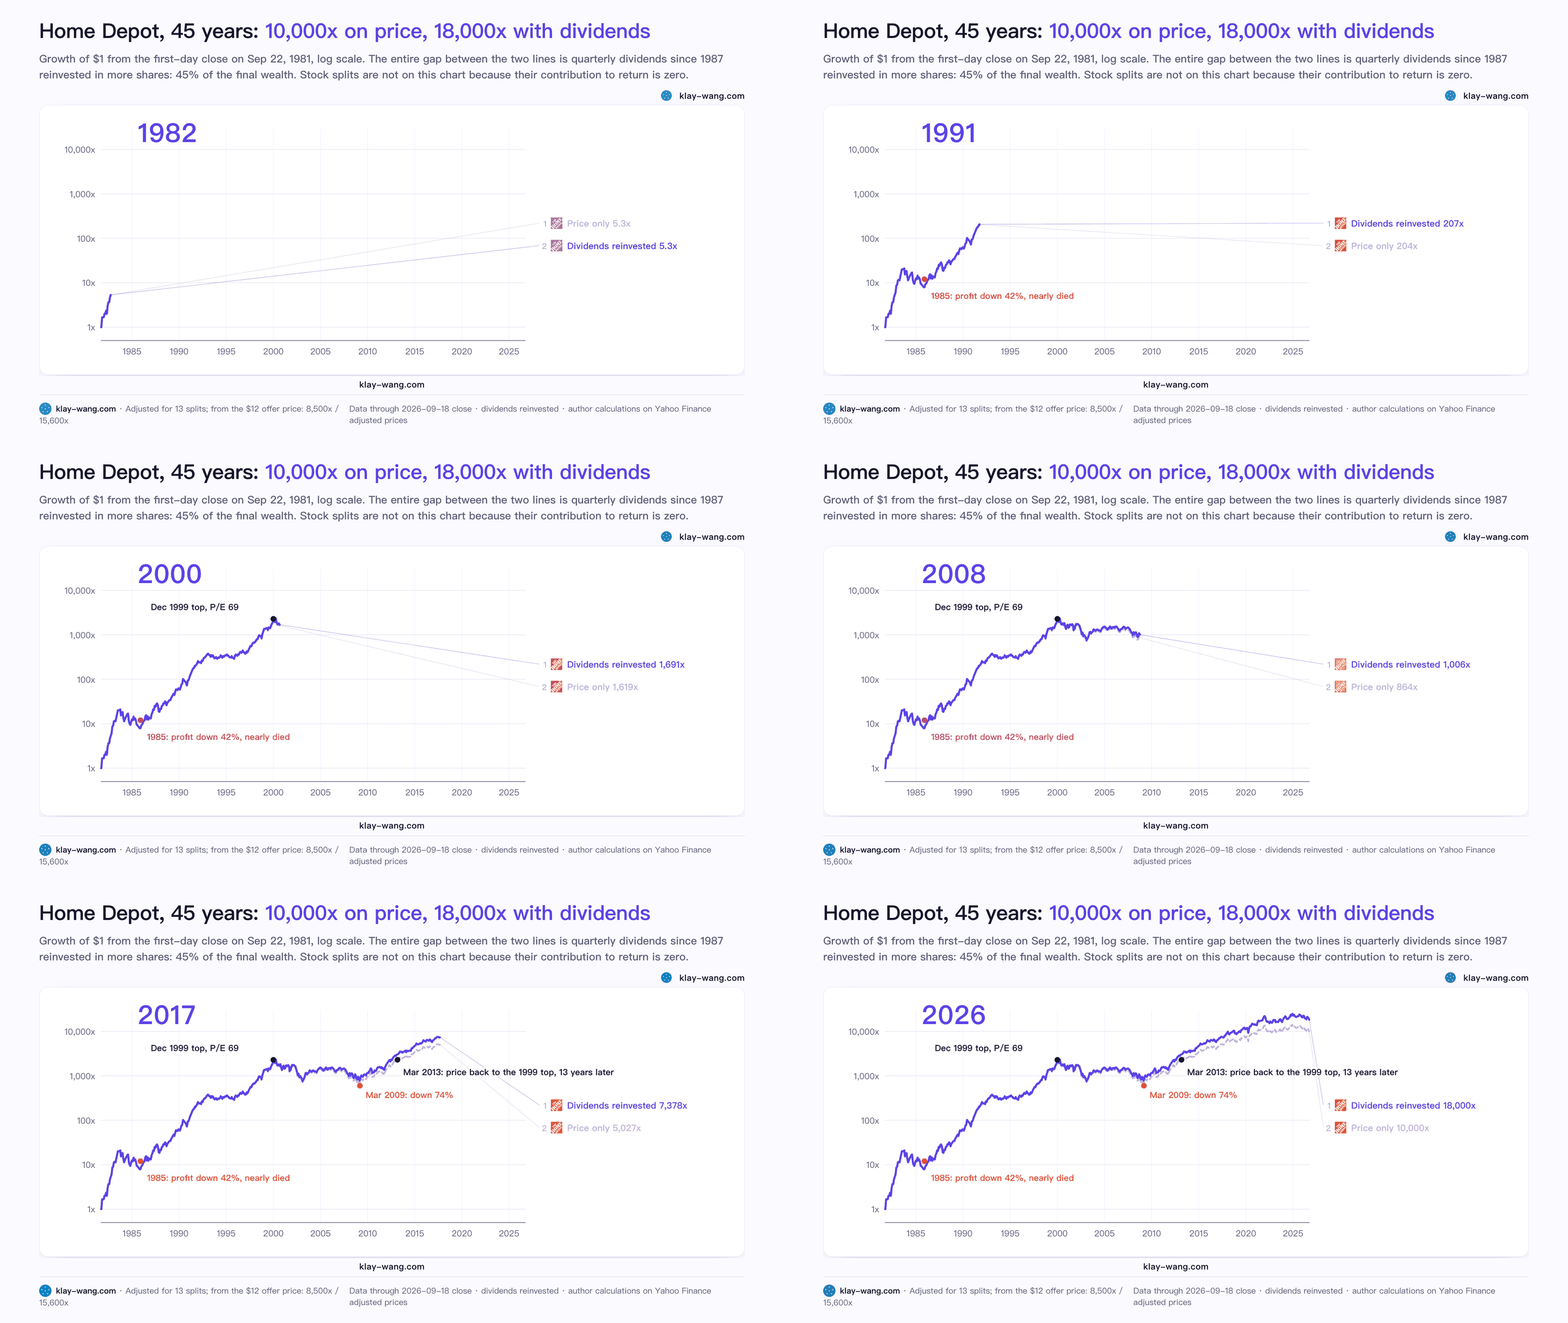
Home Depot started paying dividends in 1987 and has not missed a quarter since. In fiscal 2024 it paid out $8.9 billion, $9 a share.
Then the share count. In 2003 it had 2.36 billion shares; in 2026, under 1 billion. From 2002 through fiscal 2017 it bought back $75.1 billion of stock, and from then until it paused for the SRS deal in March 2024 it kept buying several billion to $15 billion a year, more than $100 billion in total.
The power of that shows up in earnings per share. From fiscal 2009 to fiscal 2024, net profit went from $2.7 billion to $14.8 billion, 5.5x; earnings per share went from $1.57 to $14.91, 9.5x. The extra 4x is entirely the work of a shrinking denominator.
A company that does not need new stores has only two places to put what it earns: hand it to you, or buy other people's shares and hand those to you. Home Depot did both to the limit.
Not a sentence in this section is sexy. But it is the heaviest page in the 45-year ledger. A dividend every quarter, buybacks every year, 17 years without new stores. What people call compounding is, much of the time, this kind of boring repetition.
At this point I know someone will raise two companies against me: Coca-Cola and Berkshire Hathaway. One is famous for dividends; the other never pays one and never splits. Good, they let me separate three things that usually get mixed together.
First: a stock split produces no return. Home Depot's 13 splits turned one share into 341, and each time the price fell in the same proportion; the value in your hands did not move a cent. Coca-Cola is the same. Four two-for-one splits, in 1990, 1992, 1996 and 2012, turned the 25 million shares Buffett bought for $1.3 billion into 400 million shares, and the dividend per share was divided by 16 with them. Had Coca-Cola never split, he would still hold 25 million shares paying $32.64 each a year, and the total would still be $800-million-plus. Berkshire's A shares have not split once in 60 years, one share is $760,000, and it is 60,000x all the same.
Second: what makes the dividend grow is the company raising the per-share dividend every year, and that has nothing to do with splits. On a split-adjusted basis, Coca-Cola paid 7.5 cents a share for the year in 1988 and $2.04 in 2025, and in February 2026 it raised the dividend for the 64th time, to $2.12: 28x. Buffett's $1.3 billion cost has not changed, and the dividends it collects have gone from thirty-odd million dollars in 1989 to $816 million in 2025 and $848 million in 2026. That is where the 65% yield on cost comes from.
Third: recovering your cost is not extra return. I went through Coca-Cola's dividends year by year. Cumulative dividends on the shares Berkshire started buying in 1988 passed $1.3 billion around 2002, so the cost came back in about 14 years; through the end of 2025 the total is roughly $12.5 billion, and the 400 million shares are worth $35.3 billion at the September 18, 2026 close. $1.3 billion to $47.8 billion in 37 years, a little over 10% a year. That figure already counts every dividend. The moment you recover your cost adds nothing; you have simply relabeled money already counted. Its real use is psychological: a dividend is cash in hand that a later fall cannot take back, so you can hold on. Someone who bought Home Depot at the 1999 top got back to even on price in 2013; with dividends, in August 2012, more than half a year sooner.
Put those three things back on Home Depot's books: 45% of the 16,000x is reinvested dividends, and that has nothing to do with the 13 splits and everything to do with a dividend that has been raised every quarter since 1987.
06 What Chinese readers may not know: it lost badly in China
In December 2006, Home Depot paid more than $100 million for Tianjin's Home Way, 12 stores, and formally entered China, opening later in Beijing, Tianjin, Xi'an, Zhengzhou, Shenyang and Qingdao. It went through three China presidents in six years. On September 14, 2012, it announced it was closing its last seven stores and withdrawing entirely, taking a $145 million after-tax charge; Chinese media put the total loss at about $160 million.
Things went wrong on closing day. Employees occupied four stores over the weekend, installers held three executives for 80 hours, and suppliers seized an operations manager with an injured foot.
Carol Tomé, the CFO at the time, later told the inside story. Her first point: Chinese people do not live in houses with garages, so there is nowhere to keep tools; what they think of is hiring someone to do it.
Her second was the people in the stores: 100 Home Depot employees per store, next to 200 promoters sent by manufacturers, each selling their own. The third was property: every store in China was leased, and when a cheap lease came up for renewal the rent doubled. The fourth was the most absurd: Chinese manufacturers would not sell to it in China, so it had to ship goods to the US and back again.
Not only Home Depot. Britain's B&Q sold 70% of its China business, 39 stores, to Wumart in December 2014 for £140 million. Its reason was identical: in China, fixing the house is not a leisure activity, because labor is cheap and there is always someone to do it for you.
Why can the same business not work in China? I compress it into three things:
1: The houses are different. America has 42-year-old wooden single-family houses; China has reinforced-concrete apartments built after 2000, and more and more new ones are delivered finished. A 2024 draft from the housing ministry even proposed that all new urban housing be delivered fully fitted out. The first is a machine you maintain yourself; the second is a box the property manager looks after, handed to you with the floors already laid.
2: Labor is different. Call a plumber in America and the call-out alone is $50 to $150, a job $180 to $500; doing it yourself saves money. Call a handyman in China and the call-out is a few dozen yuan; doing it yourself wastes time. DIY is a hobby in China and economics in America.
3: The chain is different. Home-improvement money in China flows through renovation contractors and building-materials markets. Malls like Red Star Macalline and Easyhome are landlords collecting rent: the goods belong to the manufacturers, the staff belong to the manufacturers, the mall only supplies the floor. Home Depot's heavy model of buying its own stock, hiring its own people and setting its own prices has no place in that chain.
Here is the interesting part: what made Home Depot fail in China is exactly what made it the best return in America. Old houses, expensive labor, no middlemen. It did nothing wrong. It is a species that can only grow in one kind of soil.
07 The return rankings are a game of definitions
Now I have to take the phrase best return in 45 years apart for you, because it is half right and half wrong.
The right half: counted from Home Depot's listing day to today, with dividends, no US stock has beaten it.
The wrong half is the starting line. Look at the table below, everything at the September 18, 2026 close.
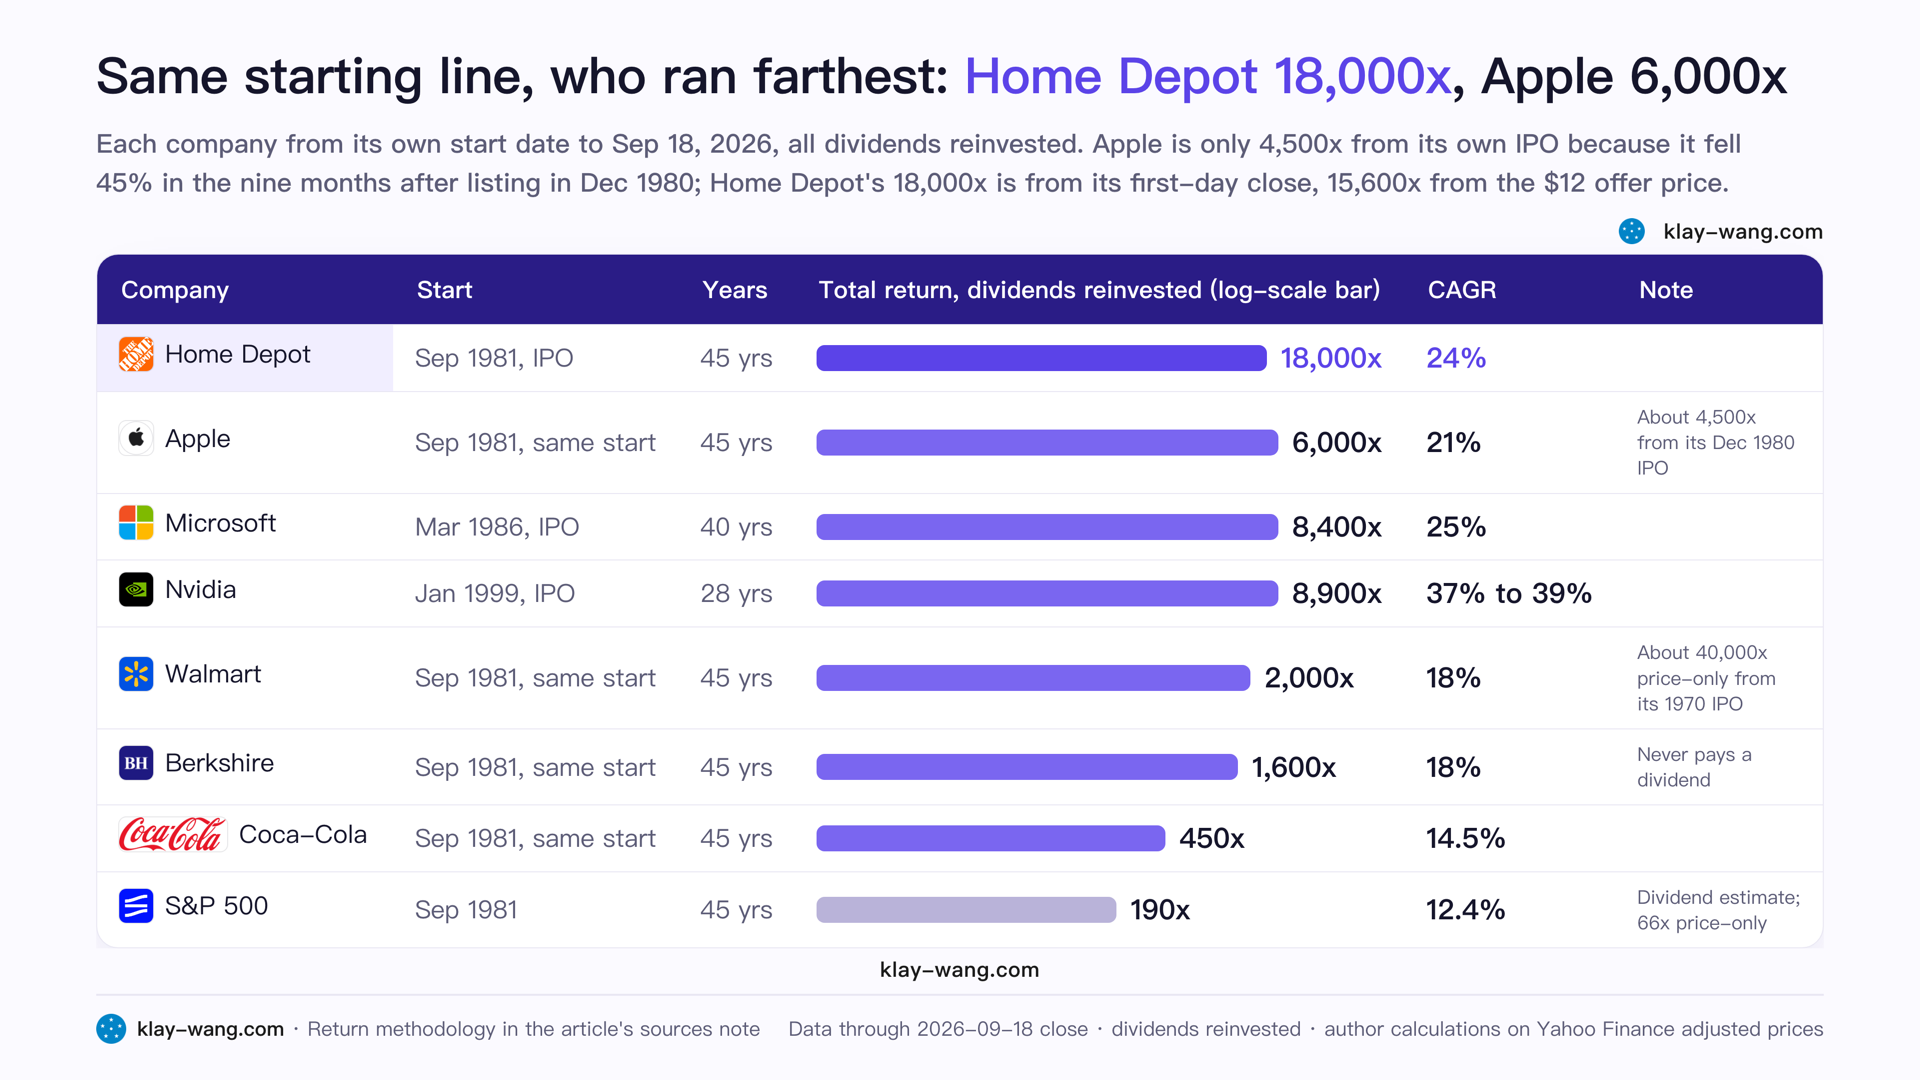
Four things:
First, Apple's start was cherry-picked. Apple listed in December 1980, and by the day Home Depot listed in September 1981 it had already fallen 45%. Count each from its own listing day and Home Depot is 4 times Apple; count from the same day and it is only 3 times. Acquired used the former.
Second, Walmart is earlier. It listed in 1970, and from its own listing day it is about 40,000x on price alone, more with dividends. So the title of best return from listing day in history actually belongs to Walmart. Home Depot holds first place in the division that starts after September 22, 1981.
Third, the S&P row needs the with-dividends number. The 66x in my table is the price index; reinvest each year's dividends and it is about 190x from September 1981, 12.4% a year. Comparing Home Depot with the index should be 18,305 against 190, not against 66. And from the same start, Buffett's Berkshire is about 1,600x and Coca-Cola about 450x, both a long way behind Home Depot.
Fourth, the annual rate is what measures investing skill. Nvidia 37% to 39%, Home Depot 24%, Apple 20%. Home Depot's cumulative multiple comes from running 18 more years; 24% a year for 45 years beats 39% a year for 27. Ask which is harder and the answer is Nvidia. Ask which an ordinary person can hold and the answer is Home Depot, because its worst drawdown in 45 years was 74%, while Nvidia fell nearly 90% in 2002, 85% in 2008 and 66% again in 2022.
One more background number. Professor Bessembinder of Arizona State counted: of 28,100 US stocks from 1926 to 2022, 58.6% lost money for shareholders, and more than $50 trillion of the $55.1 trillion of net wealth created came from the top 2% of companies. Home Depot is in the top twenty of his all-time wealth-creation list. In the latest version of that list, eight of the top ten are tech companies; the other two are Exxon and Walmart. Sellers of oil, sellers of groceries, sellers of nails.
The other side: is this company still worth looking at
Let me make the opposing case in full first.
From January 2020 to September 2026, Home Depot's total return with dividends is only 7.4% a year, the same as XLP, half the S&P. The stock is $300, nearly a fifth below its 2024 high of $368, at 21 times earnings. Fiscal 2025 profit was $14.2 billion, $600 million less than the year before, and it missed expectations in three of four quarters. On the February 25, 2026 earnings call, CEO Ted Decker said, in his words: the housing market has stalled, and our customers are telling us they will not put money into big projects. The December 2025 investor day guided fiscal 2026 to flat-to-2% comparable sales and flat-to-4% earnings per share. Mortgage rates are at a three-year low and existing-home sales still have not picked up. The second-quarter report on August 18, 2026 was a little better, comparable sales up 1.7%, the best quarter since 2022, but full-year guidance did not move a word.
The more fundamental problem: it has nothing to do with AI. The money of this era is flowing into compute. Why should a company that has done one thing for 45 years earn 24% again?
Back to the judgment.
It will not get 24% again, and I agree. The 43% a year from 1981 to 2000 was the dividend of going from four stores to a thousand, and that is over. The 25% from 2010 to 2020 was the multiple repairing from 11 to 20 plus buybacks, and that is over too. From here it is a mature company that moves with the aging of American houses: high single digits in good years, standing still in bad ones.
But let me narrow the conclusion to one sentence: the point of the Home Depot story is not that you should buy it today. Its value is as a control group.
Control for what? For the storytelling companies you hold. When you feel a company must have AI, must have a platform, must have network effects to be worth holding for 20 years, here is a seller of nails that produced the highest cumulative return in US stocks over 45 years by giving away margin, keeping veteran tradesmen in the store, not opening stores, and paying dividends and buying back shares.
What it proves is simple: money can grow out of the most boring place, provided you do not buy at 69 times.
Three sentences
1: Home Depot's 16,000x over 45 years came from giving away margin, veteran tradesmen and not opening stores, and has nothing whatsoever to do with technology.
2: Even so, buying it too dear in 1999 meant a 13-year wait, and 26 years later it made the same as a basket of toothpaste and cola. Between a good company and a good stock sits a P/E ratio.
3: It opened 12 stores in China and left. What beat it there is exactly what made it win in America.
My own two cents
Having finished this, I remembered a line from my 2020 piece on Sequoia: historical opportunity matters more; people are all too small.
Home Depot is another version of that line. It fed on the expansion of suburban single-family housing in America after the 1980s, and then on that same stock of houses collectively growing old after 2010. Two generations of houses, one company repairing them from beginning to end. Marcus and Blank were formidable, of course, but parachute the two of them into Tianjin in 2006 and they lose it all in six years just the same.
Same old line: the ability to choose your beta is itself a kind of alpha.
One more thing. I have been writing about US stocks every day this year, and I believe less and less in the word disruption. Most of the companies that actually multiply money do one thing that has not changed in a thousand years: people need to live in houses, houses break, broken houses get fixed. Swap that sentence for people need to eat, people need to drink, people need to pay, and you have McDonald's, Coca-Cola and Visa. The technology changes every ten years; these needs have never changed once.
When I pick companies now, I first ask a dumb question: would my grandfather use what it sells? Home Depot, yes. Nvidia, no. That does not mean Nvidia is bad. It means the two kinds of money have different natures: one requires you to guess the future right, the other only requires that you can afford to wait.
I am the kind who can wait. (Provided, of course, I do not get in at 69 times. I am writing that down so I can be held to it later.)
Sources and definitions: Prices and total returns are at the September 18, 2026 close (Home Depot $299.98, Apple $336.13, Microsoft $493.78, Nvidia $222.27, Walmart $106.73), computed from Yahoo Finance adjusted data with dividends reinvested. Home Depot is 15,600x from the $12 offer price and the 341x split factor and 18,300x from the first day's close; the Wall Street Journal's retelling of the Acquired podcast's $1,000-to-$16-million uses the former. Apple is about 4,500x with dividends from its December 1980 offer price of $22 and about 6,000x from September 22, 1981; the gap is Apple's fall in the nine months after listing. Walmart's October 1970 offer price was $16.50 with a split factor of 6,144, about 40,000x on price alone, dividends not counted. Nvidia is about 8,900x from its January 1999 offer price of $12 and split factor of 480, about 5,900x from the first close. Berkshire and Coca-Cola from the same start use Yahoo adjusted data (Berkshire A shares pay no dividend, so the multiple is the price multiple). The 66x for the S&P 500 in the table is the price index; the roughly 190x with dividends is estimated by chaining the S&P's annual total returns in the appendix to Berkshire's 2025 shareholder letter from 1982 through 2025 and adding the last three months of 1981 and 2026 through September 18, and the 12.4% annual rate is computed the same way. Coca-Cola: Buffett's 400 million shares and $1.299 billion cost are from Berkshire's annual reports; the four split dates are from Coca-Cola's share history; dividends per share of $0.075 in 1988, $2.04 in 2025 and $2.12 in 2026, split-adjusted, are from Yahoo and company announcements; $816 million and $848 million are shares times dividend per share; cumulative dividends of about $12.5 billion and cost recovery in 2002 are the author's estimate from split-adjusted annual dividends times shares held (373.6 million share-equivalents for 1988 to 1993, 400 million from 1994); $35.3 billion is 400 million shares times the September 18, 2026 close of $88.25. Berkshire's roughly 60,000x over 60 years and $760,000 per share are from the 2025 shareholder letter and the September 18, 2026 close. The XLP and Lowe's comparisons also use adjusted data from December 31, 1999; correlations are of monthly returns, 333 months from 1999 and 81 months from 2020. Sources differ on the 1981 IPO proceeds: Acquired and the Wall Street Journal give about $4 million and a valuation under $40 million, Motley Fool gives 600,000 shares for $7.2 million; this piece uses the former and notes the disagreement. Sources also give the item count of the first stores as anywhere from 25,000 to 45,000; both numbers appear here. The 1985 crisis, the 1986 offering and the 1989 overtaking of Lowe's are from the Funding Universe company history; the Bowater price is $38.4 million in one source and $40 million in another, given here as about $40 million. The 1999 market value of $128 billion, 1,707 stores in 2003 and $86 billion market value are from a Speedwell Research retrospective memo; 69x is the December 31, 1999 close over fiscal 1999 realized earnings per share, and 50x is that memo's forward figure. Nardelli's tenure return is from the December 5, 2000 close to the January 3, 2007 close; the 2006 annual-meeting details are from CNN Money and CFO.com reports at the time; Blake's tenure is January 3, 2007 to November 3, 2014. The three HD Supply transactions are from Home Depot's 2006 and 2007 announcements and the December 2020 acquisition announcement. Revenue, store counts, earnings per share, dividends, buybacks and headcount are from Home Depot's 10-Ks and earnings releases; the $75.1 billion of buybacks from fiscal 2002 through 2017 is from the 10-K, and the later cumulative figure is a year-by-year estimate. The roughly half share of Pro is the company's own figure and PYMNTS reporting; $18.25 billion is the SRS purchase price; about $5.5 billion for GMS includes debt. Decker's quote is from Fortune's report of the February 25, 2026 earnings call; 2026 guidance is from the December 9, 2025 investor-day release. The 42-year median home age and 47% are NAHB's tabulation of the 2024 American Community Survey; the 65% homeownership rate is from the Census Bureau; the 54% owner-occupied single-family share is NAHB's tabulation of 2023 data; 4.06 million existing-home sales are from the National Association of Realtors; $520 billion of repair and improvement spending is the Harvard Joint Center's LIRA projection for 2026; plumber prices are HomeAdvisor's 2025 figures. The China section draws on Home Depot's fiscal 2012 10-Q, the 2013 public remarks by Carol Tomé in Atlanta (Saporta Report), and Tencent Finance and CCTV reports from September 2012; the B&Q transaction is from Kingfisher's December 2014 announcement; the fully-fitted policy is from the housing ministry's February 2024 draft Residential Project Code. Bessembinder's data are from his 2023 paper Shareholder Wealth Enhancement, 1926 to 2022. All multiples in this piece are historical returns and do not constitute investment advice.
Comments留言